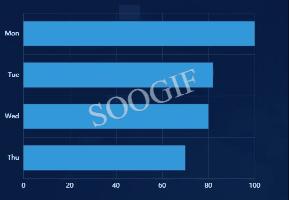
echarts图形数据过多自动滚动
因项目使用echarts数据过多自己滚动
效果如下:

代码如下:
<template>
	<div id="echarts" style="width: 500px; height: 400px"></div>
</template>
<script>
import echarts from "echarts";
export default {
  name: "",
  data() {
    return {
  created() {
  mounted() {
    this.customElements();
  methods: {
    customElements() {
      var myChart = echarts.init(document.getElementById("echarts"));
      var KSMC = [100, 82, 80, 70, 65, 66, 60, 54, 50, 42, 40];
      var option = {
        color: ["#3398DB"],
        tooltip: {
          trigger: "axis",
          axisPointer: {
            // 坐标轴指示器,坐标轴触发有效
            type: "shadow", // 默认为直线,可选为:'line' | 'shadow'
        grid: {
          left: "3%",
          right: "4%",
          bottom: "3%",
          containLabel: true,
         xAxis: {
          //坐标轴类型(类目轴)
          name: "",
          type: "value",
          //坐标轴两边留白策略
          boundaryGap: true,
          //是否显示坐标轴刻度
          axisTick: { show: false },
          //坐标轴线线的颜色
          axisLine: {
            show: true,
            lineStyle: {
              color: "#fff",
              opacity: 0.1,
          axisLabel: {
            show: true,
            formatter: function (value, index) {
              var value;
              // if判断转换值
              return value;
          //是否显示网格线。默认数值轴显示
          splitLine: {
            show: true,
            //颜色线宽
            lineStyle: {
              color: "#fff",
              opacity: 0.1,
         legend: {
          show: true,
          type: "plain", //scroll滚动图例
          data: ["数量"], //图裂名称(需填写)
          top: "10%",
          textStyle: {
            color: "#ffffff",
        dataZoom: [
          //滑动条
            yAxisIndex: 0, //这里是从X轴的0刻度开始
            show: false, //是否显示滑动条,不影响使用
            type: "slider", // 这个 dataZoom 组件是 slider 型 dataZoom 组件
            startValue: 0, // 从头开始。
            endValue: 3, // 一次性展示6个。
        yAxis: [
            type: "category",
            inverse: true, //是否是反向坐标轴
            data: ["Mon","Tue","Wed","Thu","Fri","Sat","Sun","测试","测试1","测试2","测试3",],
             axisLabel: {
            show: true,
            formatter: function (value, index) {
              var value;
              // if判断转换值
              return value;
          //是否显示分隔线。默认数值轴显示
          splitLine: {
            show: true,
            lineStyle: {
              color: "#fff",
              opacity: 0.1,
          axisTick: { show: false },
          //坐标轴线线的颜色
          axisLine: {
            show: true,
            lineStyle: {
              color: "#fff",
              opacity: 0.1,
        series: [
            name: "直接访问",
            type: "bar",
            barWidth: "60%",
            data: KSMC,
      myChart.setOption(option);
	  //自动滚动
      this.timeOut=setInterval(()=>{
        if (option.dataZoom[0].endValue == KSMC.length ) {
          option.dataZoom[0].endValue = 3;
          option.dataZoom[0].startValue = 0;
        } else {
          option.dataZoom[0].endValue = option.dataZoom[0].endValue + 1;
          option.dataZoom[0].startValue = option.dataZoom[0].startValue + 1;
        myChart.setOption(option);
