HighCharts
是纯Js实现的、功能丰富的图表库,相关
API
访问
链接
在
HTML
页面渲染好的
HighCharts
图表,可以获取其
SVG
信息并发送后台,进一步创建图表文件(JPG、PNG等)
试图不经前端渲染直接后台生成图表文件,只靠
HighCharts
目前是无法实现的
如果可以在后台模拟前端
HTML
的渲染过程,是否就可以解决问题了呢?答案是肯定的。问题关键在于
How
,怎么做。
PhantomJS
(幻影)就是用以实现模拟前端渲染的独立程序,下载
地址
,这在
HighCharts
官网也是被支持的,相关
链接
这是摘自
HighCharts
官方一段说明,相关
链接
研究官方的说明文档固然是好的,但是未免枯燥无聊且操作复杂,
能不能傻瓜式一键搞定?
 幸运的是大牛
Espen Hovlandsdal
已经帮我们封装好了!
幸运的是大牛
Espen Hovlandsdal
已经帮我们封装好了!
highcharts-png-renderer
,访问
地址
,从Git上把项目
clone
下来后,结构如下图所示
将从
PhantomJS
官网下载的
phantomjs.exe
文件放到
highcharts-png-renderer 子文件路径下
并 执行命令:
phantomjs run.js
,如图所示
命令窗口输出
Listening on port 11942
说明服务已正常启动
打开
PostMan
模拟HTTP请求,参数和返回值如下,
惊不惊喜!意不意外!
|
类型
|
POST
|
|
|
URL
|
http://127.0.0.1:11942/
|
|
参数
|
|
中篇:行百里半九十,下面才是
正题
如果你可以将
highcharts-png-renderer
做成服务,随机自启、持续运行、时刻待命,这是最好的解决方案!!!
关于 将bat做成服务 的相关知识,参考
地址
但是,如果想智能化处理渲染器的关停,那么就要自己实现了
1、
Demo
的项目结构
依据业务逻辑划分,将
highcharts-png-renderer
重命名为
renderer
,将
renderer
、
phantomjs.exe
、
mould.json
置于文件夹
highcharts-renderer
内,其磁盘路径在
RenderUtil.java
中有使用到,这应写入配置文件中
项目结构如下图所示:
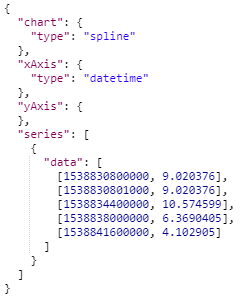
2、
mould.json
HighCharts的Option属性包含很多参数,大多数参数对于一个稳定的项目来说是固定不变的,为了减少代码冗余,建一个模板Option,使用时读取,只将需要修改的少量参数替换掉即可
mould.json模板示例:
"global": {
"useUTC": false
"chart": {
"renderTo": "container",
"type": "spline",
"height": 300,
"width": 500,
"marginTop": 45,
"marginBottom": 45
"title": {
"text": "",
"style": {
"color": "rgb(139, 134, 134)",
"font": "bold 1.1em 'Trebuchet MS', Verdana, sans-serif"
"credits": {
"enabled": false
"legend": {
"enabled": false
"xAxis": {
"title": {
"enabled": true,
"text": "",
"align": "high",
"style": {
"color": "rgb(114, 111, 111)"
"labels": {
"style": {
"color": "rgb(114, 111, 111)"
"dateTimeLabelFormats": {
"day": "%e. %b",
"minute": "%H:%M"
"type": "datetime",
"showLastLabel": true,
"minRange": 60000,
"tickPixelInterval": 80,
"lineWidth": 1,
"lineColor": "#A0A0A0",
"gridLineWidth": 0,
"gridLineColor": "#E8E8E8"
"yAxis": {
"title": {
"enabled": true,
"text": "",
"style": {
"color": "rgb(114, 111, 111)"
"labels": {
"style": {
"color": "rgb(114, 111, 111)"
"minRange": 0.0004,
"tickPixelInterval": 25,
"lineWidth": 1,
"lineColor": "#A0A0A0",
"gridLineWidth": 0,
"gridLineColor": "#E8E8E8"
"plotOptions": {
"spline": {
"lineWidth": 1,
"pointInterval": 60000,
"marker": {
"enabled": false
"series": [
"id": "curve_line",
"color": "rgba(0, 0, 255, 1.0)",
"data": [
[1538830800000, 9.020376],
[1538830801000, 9.020376],
[1538834400000, 10.574599],
[1538838000000, 6.3690405],
[1538841600000, 4.102905]
3、
RenderUtil.java
渲染器工具类,包含
mould.json
载入、
highcharts-png-renderer
服务的启动和关闭、发往 渲染器服务的HTTP请求和接收 以及图表文件的本地存储
import com.alibaba.fastjson.JSONArray;
import com.alibaba.fastjson.JSONObject;
import org.apache.commons.io.FileUtils;
import org.apache.commons.lang3.StringUtils;
import org.apache.http.HttpEntity;
import org.apache.http.client.methods.CloseableHttpResponse;
import org.apache.http.client.methods.HttpPost;
import org.apache.http.entity.StringEntity;
import org.apache.http.impl.client.CloseableHttpClient;
import org.apache.http.impl.client.HttpClients;
import org.apache.http.util.EntityUtils;
import java.io.File;
import java.io.IOException;
import java.util.Date;
public class RenderUtil {
private static String highChartOptionMouldString = null;
private static Process highChartsRendererProcess = null;
//以下常量可写入配置文件
private static final String localTempFolder = "D:/temp/charts";
private static final String highChartsRendererPath = "D:/highcharts-renderer";
private static final String highChartsRendererUrl = "http://127.0.0.1:11942/";
* 格式化文件路径
* @param path
* @return
public static String formatPath(String path) {
if (StringUtils.isBlank(path)) {
return "";
while (path.indexOf("\\") > -1) {
path = path.replace("\\", "/");
while (path.indexOf("//") > -1) {
path = path.replace("//", "/");
return path;
* 载入HighCharts的模板Option
private static void loadHighChartOptionMould() throws IOException {
String mouldPath = highChartsRendererPath + "/mould.json";
mouldPath = formatPath(mouldPath);
String content = FileUtils.readFileToString(new File(mouldPath), "UTF-8");
if (null != content) {
JSONObject mouldJson = JSONObject.parseObject(content);//为了验证格式的正确性
highChartOptionMouldString = mouldJson.toJSONString();
* 启动 HighCharts 渲染器
* @return
synchronized public static boolean startRenderer() {
if (null != highChartsRendererProcess) {
endRenderer();
try {
String phantomJs = highChartsRendererPath + "/phantomjs";
phantomJs = formatPath(phantomJs);
String runJs = highChartsRendererPath + "/renderer/run.js";
runJs = formatPath(runJs);
Runtime rt = Runtime.getRuntime();
highChartsRendererProcess = rt.exec(phantomJs + " " + runJs);
(new Robot()).delay(10 * 1000);//延时10s,防止服务尚未启动完全即刻发送HTTP请求
return true;
} catch (Exception e) {
e.printStackTrace();
return false;
* 销毁 HighCharts 渲染器
* @return
synchronized public static void endRenderer() {
if (null != highChartsRendererProcess) {
highChartsRendererProcess.destroy();
highChartsRendererProcess = null;
try {
(new Robot()).delay(10 * 1000);//延时10s,防止服务尚未完全关闭即刻再启服务
} catch (Exception e) {
e.printStackTrace();
* 发送给HighCharts渲染器,取得图表的字节流
* @param param
* @return
synchronized private static byte[] post2Renderer(String param) {
CloseableHttpResponse response = null;
try {
HttpPost post = new HttpPost(highChartsRendererUrl);
if (StringUtils.isNotBlank(param)) {
StringEntity entity = new StringEntity(param, "utf-8");
entity.setContentEncoding("UTF-8");
entity.setContentType("application/json");
post.setEntity(entity);
// TODO 处理请求超时
CloseableHttpClient client = HttpClients.createDefault();
response = client.execute(post);
HttpEntity entity = response.getEntity();
byte[] bytes = EntityUtils.toByteArray(entity);
EntityUtils.consume(entity);//关闭流
return bytes;
} catch (Exception e) {
e.printStackTrace();
return null;
} finally {
if (null != response) {
try {
response.close();
} catch (Exception e) {
e.printStackTrace();
* 存储图表到本地,返回文件路径
* @param chartTitle 图表标题
* @param xAxisTitle x轴的标题
* @param yAxisTitle y轴的标题
* @param data 数据
* @return
synchronized public static String storeChart(String chartTitle, String xAxisTitle, String yAxisTitle, JSONArray data) {
if (null == highChartOptionMouldString) {
try {
loadHighChartOptionMould();
} catch (IOException e) {
e.printStackTrace();
return null;
//变相实现深度拷贝
JSONObject mouldJson = JSONObject.parseObject(highChartOptionMouldString);
JSONObject title = mouldJson.getJSONObject("title");
title.put("text", chartTitle);
JSONObject xAxis = mouldJson.getJSONObject("xAxis");
JSONObject xTitle = xAxis.getJSONObject("title");
xTitle.put("text", xAxisTitle);
JSONObject yAxis = mouldJson.getJSONObject("yAxis");
JSONObject yTitle = yAxis.getJSONObject("title");
yTitle.put("text", yAxisTitle);
mouldJson.put("series", data);
if (null != data.get(0)) {
JSONObject line1 = data.getJSONObject(0);
JSONArray data1 = line1.getJSONArray("data");
if (null != data1 && data1.size() < 2) {
JSONObject plotOptions = mouldJson.getJSONObject("plotOptions");
JSONObject spline = plotOptions.getJSONObject("spline");
JSONObject marker = spline.getJSONObject("marker");
marker.put("enabled", true);//显示散点
byte[] bytes = post2Renderer(mouldJson.toJSONString());
if (null == bytes) {
return null;
try {
String localPath = localTempFolder + "/" + (new Date()).getTime() + ".png";
localPath = formatPath(localPath);
FileUtils.writeByteArrayToFile(new File(localPath), bytes);
return localPath;
} catch (Exception e) {
e.printStackTrace();
return null;
4、RunMain.java
这是一个简单的测试用例主函数,如下
import com.alibaba.fastjson.JSONArray;
import com.alibaba.fastjson.JSONObject;
import java.util.ArrayList;
import java.util.List;
public class RunMain {
public static void main(String[] args) {
d0Render();
* 启动服务生成图表文件到本地
synchronized public static void d0Render() {
try {
boolean success = RenderUtil.startRenderer();
if (success) {
String chartPath = loadData2Chart();
if (null != chartPath) {
System.out.println("数据载入成功,图表文件生成后的路径:" + chartPath);
} catch (Exception e) {
e.printStackTrace();
} finally {
RenderUtil.endRenderer();
* 载入数据生成图表,并存储本地
* @return
private static String loadData2Chart() {
double[] l1p1 = {1538830800000.0, 9.020376};//线1点1
double[] l1p2 = {1538830801000.0, 9.020376};
double[] l1p3 = {1538834400000.0, 10.574599};
double[] l1p4 = {1538838000000.0, 6.3690405};
double[] l1p5 = {1538841600000.0, 4.102905};
double[] l2p1 = {1538830800000.0, 5.020376};//线2点1
double[] l2p2 = {1538834400000.0, 5.574599};
double[] l2p3 = {1538841600000.0, 5.102905};
List<double[]> data1 = new ArrayList<double[]>();
data1.add(l1p1);
data1.add(l1p2);
data1.add(l1p3);
data1.add(l1p4);
data1.add(l1p5);
// TODO 按x值排序
List<double[]> data2 = new ArrayList<double[]>();
data2.add(l2p1);
data2.add(l2p2);
data2.add(l2p3);
// TODO 处理时区错乱
JSONObject line1 = new JSONObject();
line1.put("id", "blue");
line1.put("color", "rgba(0, 0, 255, 1.0)");
line1.put("data", data1);
JSONObject line2 = new JSONObject();
line2.put("id", "red");
line2.put("color", "rgba(255, 0, 0, 1.0)");
line2.put("data", data2);
JSONArray lines = new JSONArray();
lines.add(line1);
lines.add(line2);
return RenderUtil.storeChart("演示图表", "Date", "Value", lines);
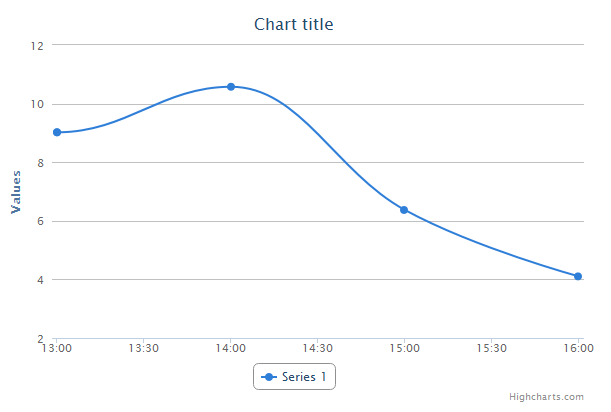
5、实测效果图
控制台输出:数据载入成功,图表文件生成后的路径:D:/temp/charts/*.png
2、HighCharts 时区错乱问题
仔细观察生成的图表文件,蓝线 峰值点对应x坐标值为 14:00,但是我们的输入值 1538834400000.0 毫秒是 22:00,正好差8个小时!!
double[] l1p3 = {1538834400000.0, 10.574599};
错误原因是渲染器使用了国际时间,东八区的我们自然会比国际时间早8个小时
解决方案:在mould.json中配置参数
"global": {
"useUTC": false
测试结果:渲染器中毫无卵用,经HTML前端渲染后却是有效的,至于原因嘛。。简单推断可能是 highcharts-png-renderer 的服务所采用的 HighCharts 版本太低
再次尝试解决:使用最新 HighCharts 包替换 highcharts-png-renderer 服务内 libs 文件夹下的 highcharts.js 和 highcharts-more.js
测试结果:毫无变化,偶尔产生纯黑图表
赶时间的我即不想研究源码也不想瞎猜,简单暴力点:
在 RunMain.java 的方法 loadData2Chart 内 // TODO 处理时区错乱 处直接再加8小时
//手动处理时区错乱问题
for (double[] data : data1) {
data[0] += 8 * 60 * 60 * 1000;
for (double[] data : data2) {
data[0] += 8 * 60 * 60 * 1000;
@All 如果你有更好解决方案,请务必 @我
测试结果:符合预期
3、渲染器的稳定性问题
测试中发现渲染器经常卡死无响应,严重阻塞执行流程
优化方案:调整类 RenderUtil.java 中的方法 post2Renderer,增加超时判断并停服重连
* 发送给HighCharts渲染器,取得图表的字节流
synchronized private static byte[] post2Renderer(String param) {
CloseableHttpResponse response = null;
try {
HttpPost post = new HttpPost(highChartsRendererUrl);
if (StringUtils.isNotBlank(param)) {
StringEntity entity = new StringEntity(param, "utf-8");
entity.setContentEncoding("UTF-8");
entity.setContentType("application/json");
post.setEntity(entity);
RequestConfig config = RequestConfig.custom()
.setSocketTimeout(2 * 60 * 1000).setConnectTimeout(30 * 1000).build();
post.setConfig(config);
CloseableHttpClient client = HttpClients.createDefault();
for (int i = 0; i < 3; i++) {
try {
response = client.execute(post);
HttpEntity entity = response.getEntity();
byte[] bytes = EntityUtils.toByteArray(entity);
EntityUtils.consume(entity);//关闭流
return bytes;
} catch (SocketTimeoutException e) {
e.printStackTrace();
endRenderer();
startRenderer();
System.out.println("Try and try but fail: " + param);
} catch (Exception e) {
e.printStackTrace();
} finally {
if (null != response) {
try {
response.close();
} catch (Exception e) {
e.printStackTrace();
return null;
4、Data 数据应当是已排序的
类 RunMain.java 的方法 loadData2Chart 中的变量 data1 和 data2 put 进 line 之前,应当是按x值已排序好的,升序或降序都可以,否则图表会出现错乱,如下图所示
double[] l1p1 = {1538830800000.0, 9.020376};//线1点1
double[] l1p2 = {1538830801000.0, 9.020376};
double[] l1p3 = {1538834400000.0, 10.574599};
double[] l1p4 = {1538838000000.0, 6.3690405};
double[] l1p5 = {1538841600000.0, 4.102905};
List<double[]> data1 = new ArrayList<double[]>();
data1.add(l1p1);//顺序不对
data1.add(l1p5);
data1.add(l1p4);
data1.add(l1p3);
data1.add(l1p2);
解决方案:
Collections.sort(data1, new Comparator<double[]>() {
public int compare(double[] p1, double[] p2) {
if (p1[0] < p2[0]) {
return -1;
if (p1[0] > p2[0]) {
return 1;
return 0;
pom.xml
<dependencies>
<dependency>
<groupId>org.apache.commons</groupId>
<artifactId>commons-lang3</artifactId>
<version>3.8.1</version>
</dependency>
<dependency>
<groupId>commons-io</groupId>
<artifactId>commons-io</artifactId>
<version>2.6</version>
</dependency>
<dependency>
<groupId>com.alibaba</groupId>
<artifactId>fastjson</artifactId>
<version>1.2.54</version>
</dependency>
<dependency>
<groupId>org.apache.httpcomponents</groupId>
<artifactId>httpclient</artifactId>
<version>4.5.6</version>
</dependency>
</dependencies>
上篇:强大的PhantomJS,牛逼的Espen HovlandsdalHighCharts 是纯Js实现的、功能丰富的图表库,相关API访问链接在HTML页面渲染好的HighCharts图表,可以获取其SVG信息并发送后台,进一步创建图表文件(JPG、PNG等)试图不经前端渲染直接后台生成图表文件,只靠HighCharts目前是无法实现的 如果可以在后台模拟前端HTML的...

