航线地图上的动画飞行效果怎么实现?只要五步轻松上手
Animate a point along a route
最近有 Mapbox 社群里的开发者问 Max:
Hi, Max!我在做航线图,想要做出飞机沿着航线飞过的动画效果, Max 你知道怎么实现吗?
Max 回去苦心研究,查阅了各个教程, 终于研究出了如何实现航线地图上的飞行动画效果!
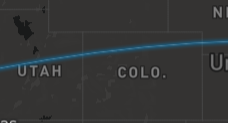
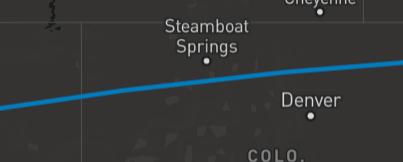
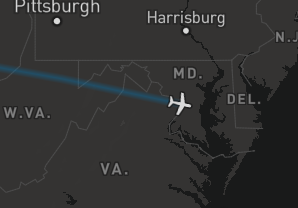
今天, 我将教大家如何用 Mapbox Gl Js 联合 Turf.js 来实现下面的动画飞行效果!
点击这里在线查看 Codepen 上的代码与作品(最好用电脑哦)
展示效果如下:


如果你对 Mapbox Gl Js 有点陌生, 请查看以下教程熟悉一下:
中文视频教程 | 如何使用 Mapbox GL JS 把标记添加到地图上(含字幕)
35 个你不知道却特好用的 Mapbox GL JS 插件 #GoGlobal Web Week
Mapbox GL JS 又更新了?v1.10.0 四大亮点不可错过!
第1步:确定底图
这次我们直接使用 Mapbox 模板样式 mapbox://styles/mapbox/dark-v10 (当然,你也可以使用属于自己的地图样式), 然后使用你的 accesss token, 创建一个地图页面。
部分代码如下:
  // TO MAKE THE MAP APPEAR YOU MUST
  // ADD YOUR ACCESS TOKEN FROM
  // https://account.mapbox.com
  mapboxgl.accessToken = 'YOUR ACCESS TOKEN';
    var map = new mapboxgl.Map({
        container: 'map',
        style: 'mapbox://styles/mapbox/dark-v10',
        center: [-96, 37.8],
        zoom: 3
更多关于地图样式的请查看:
这幅超可爱的故事地图是怎么做的?Mapbox Studio Classic 地图样式重制思路
第2步:添加航线数据
然后你需要添加你的航线数据, 这里我们简单使用单个航线的数据作为示范。这条航线,始于旧金山, 结束于华盛顿特区。
// San Francisco
    var origin = [-122.414, 37.776];
    // Washington DC
    var destination = [-77.032, 38.913];
    // A simple line from origin to destination.
    var route = {
        'type': 'FeatureCollection',
        'features': [
                'type': 'Feature',
                'geometry': {
                    'type': 'LineString',
                    'coordinates': [origin, destination]
如果你的航线数据很多但又不想用数据库, 也可以尝试使用下面这个方案
把 Excel 的内容实时更新到交互地图!Mapbox 推出开源工具 Sheet Mapper
第3步:为你的航线添加飞机飞行的动画效果
这是最关键的一步!
首先,我们要沿着航线添加一个移动的点, 这个点从起始点运动到终点。
    var point = {
        'type': 'FeatureCollection',
        'features': [
                'type': 'Feature',
                'properties': {},
                'geometry': {
                    'type': 'Point',
                    'coordinates': origin
    };
这里我们要借助 Turf.js 来计算路线起点/终点之间的距离,单位为公里。
    // Calculate the distance in kilometers between route start/end point.
    var lineDistance = turf.lineDistance(route.features[0], 'kilometers');
    var arc = [];
接着, 在两点的 "原点 "和 "终点 "之间画一条弧线。并且写明这个点沿着弧线运动的步数 500。步数 (Steps)越多表示越好, 可以显示更平滑的动画效果,但步数太多也会造成低帧率。
    // Number of steps to use in the arc and animation, more steps means
    // a smoother arc and animation, but too many steps will result in a
    // low frame rate
    var steps = 500;
    // Draw an arc between the `origin` & `destination` of the two points
    for (var i = 0; i < lineDistance; i += lineDistance / steps) {
        var segment = turf.along(route.features[0], i, 'kilometers');
        arc.push(segment.geometry.coordinates);
    }
我们还要更新点的移动坐标, 用上面计算出的圆弧坐标。
    // Update the route with calculated arc coordinates
    route.features[0].geometry.coordinates = arc;
    // Used to increment the value of the point measurement against the route.
    var counter = 0;
别忘了最重要的 animate 函数!
        function animate() {
            // Update point geometry to a new position based on counter denoting
            // the index to access the arc.
            point.features[0].geometry.coordinates =
                route.features[0].geometry.coordinates[counter];
            // Calculate the bearing to ensure the icon is rotated to match the route arc
            // The bearing is calculate between the current point and the next point, except
            // at the end of the arc use the previous point and the current point
            point.features[0].properties.bearing = turf.bearing(
                turf.point(
                    route.features[0].geometry.coordinates[
                        counter >= steps ? counter - 1 : counter
                turf.point(
                    route.features[0].geometry.coordinates[
                        counter >= steps ? counter : counter + 1
            );
第5步:把航线,动画效果的图层展示在地图上
在 add Layer 这里,你要做的选择合适的线样式,图标样式, 把航线及飞行动画效果最终呈现在地图上。
一般情况, 你只需要设置线的基础样式,例如 line- width,line-color 即可。但受到的 Jonni Walker 的教程影响,这次我决定把线设置成发光的样式(以配合我的暗黑风格地图样式)

发光的效果

普通的样式

查看 Jonni Walker 的教程: 如何让你的数据发光?“ 萤火虫 ”风格地图制作方法大揭秘!| Mapbox Studio 教程
接着这意味着,我设置了3条重叠的但样式不一样的 Line 来创造发光的航线!
        map.addLayer({
            'id': 'route',
            'source': 'route',
            'type': 'line',
            'paint': {
                'line-width':6,
                'line-blur': 3,
                'line-opacity': 0.4,
                'line-color': '#007cbf'
      map.addLayer({
            'id': 'route2',
            'source': 'route',
            'type': 'line',
            'paint': {
                'line-width':3,
                'line-blur': 3,
                'line-opacity': 0.4,
                'line-color': '#009df2'
      map.addLayer({
            'id': 'route3',
            'source': 'route',
            'type': 'line',
            'paint': {
                'line-width':0.2,
                'line-blur': 1,
                'line-opacity': 1,
                'line-color': '#fafdff'
然后我还要在地图上添加飞行动画!我直接用了 Mapbox 自带的 Icon—airport-15。

        map.addLayer({
            'id': 'point',
            'source': 'point',
            'type': 'symbol',
            'layout': {
                'icon-image': 'airport-15',
                'icon-rotate': ['get', 'bearing'],
                'icon-rotation-alignment': 'map',
