vue项目中使用mxgraph流程图
前言
mxgraph在vue中的搭建
mxgraph在vue中的基本使用
mxgraph在vue中的json和xml互转
mxgraph最主要的难点还是它的全英文文档,不仅api众多,网上能查到的资源也比较少,所以虽然它功能强大,但估计使用的人也不会很多,而且mxgraph使用的数据格式是xml,这在前后端的交互中几乎是不可用的,因为我们一般都需要转成json来存储和操作,本教程主要解决的就是这一点!
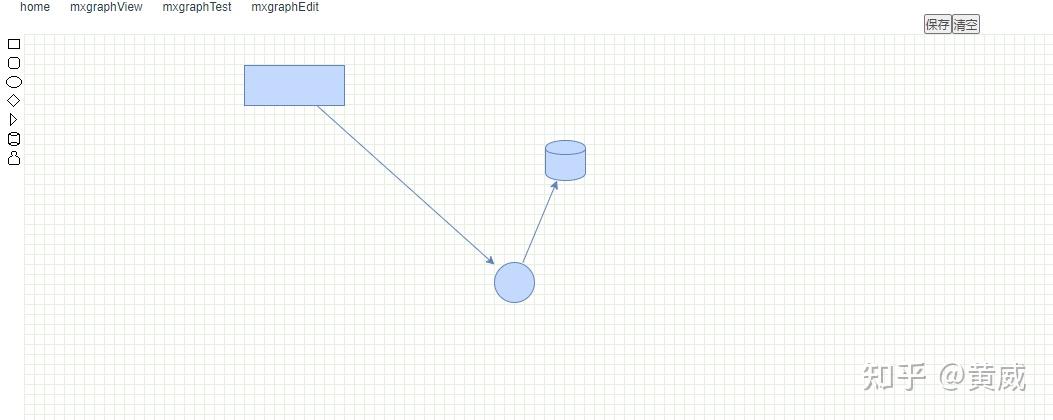
项目截图

github地址
在线演示
- 在 mxgraphEdit 页面中点击保存,会把xml转成json存储在LocalStorage
- 然后在mxgraphView页面中查看,此处从LocalStorage中取出json并转成xml进行渲染
附一个mxgraph官方文档
项目准备
npm install开发环境
npm run serve生产环境
npm run build
项目里搭建mxgraph
1、安装
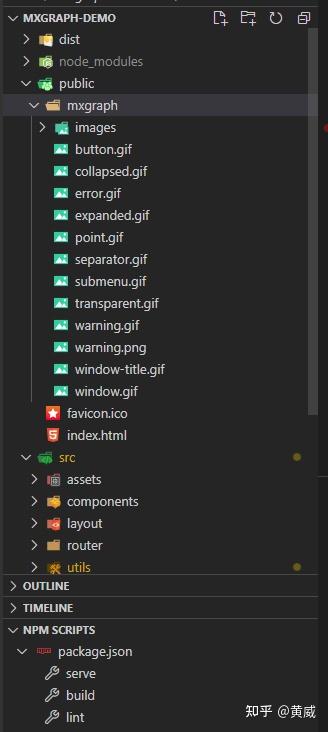
npm install mxgraph --save2、在项目public目录下引入mxgraph的静态文件,如下

3、建立mxgraph.js
import mx from 'mxgraph'
const mxgraph = mx({
  mxImageBasePath: './src/images',
  mxBasePath: './src'
window.mxGraph = mxgraph.mxGraph
window.mxGraphModel = mxgraph.mxGraphModel
window.mxEditor = mxgraph.mxEditor
window.mxGeometry = mxgraph.mxGeometry
window.mxDefaultKeyHandler = mxgraph.mxDefaultKeyHandler
window.mxDefaultPopupMenu = mxgraph.mxDefaultPopupMenu
window.mxStylesheet = mxgraph.mxStylesheet
window.mxDefaultToolbar = mxgraph.mxDefaultToolbar
window.mxToolbar = mxgraph.mxToolbar
window.mxCell = mxgraph.mxCell
window.mxCodec = mxgraph.mxCodec
window.mxEvent = mxgraph.mxEvent
window.mxUtils = mxgraph.mxUtils
window.mxConstants = mxgraph.mxConstants
export default mxgraph
4、vue页面中引入
import mxgraph from '@/utils/mxgraph'
const { mxGraph, mxGraphModel, mxUtils, mxCell, mxToolbar, mxGeometry, mxEvent, mxCodec } = mxgraph
const MxGraph = mxGraph
const MxGraphModel = mxGraphModel
const MxUtils = mxUtils
const MxCell = mxCell
const MxToolbar = mxToolbar
const MxGeometry = mxGeometry
const MxEvent = mxEvent
const MxCodec = mxCodec
5、引入json和xml互转的插件x2js
npm install x2js --save6、在main.js中引入x2js
import x2js from 'x2js' // xml数据处理插件
Vue.prototype.$x2js = new x2js() // 创建x2js对象,挂到vue原型上
7、页面中使用
// json => xml
const json = localStorage.getItem('mxgraphjson') ? JSON.parse(localStorage.getItem('mxgraphjson')) : {}
const xml = this.$x2js.js2xml(json)
// 创建一个div作为toolbar的容器
    const tbContainer = document.createElement('div')
    tbContainer.style.position = 'absolute'
    tbContainer.style.overflow = 'hidden'
    tbContainer.style.padding = '2px'
    tbContainer.style.left = '0px'
    tbContainer.style.top = '0px'
    tbContainer.style.width = '24px'
    tbContainer.style.bottom = '0px'
    this.$refs.container.appendChild(tbContainer)
    // 创建一个mxToolbar
    const toolbar = new MxToolbar(tbContainer)
    toolbar.enabled = false
    // 创建一个div作为graph的容器
    const container = document.createElement('div')
    container.style.position = 'absolute'
    container.style.overflow = 'hidden'
    container.style.left = '24px'
    container.style.top = '0px'
    container.style.right = '0px'
    container.style.bottom = '0px'
    container.style.background = 'url("./mxgraph/images/grid.gif")'
    this.$refs.container.appendChild(container)
    this.model = new MxGraphModel()
    this.graph = new MxGraph(container, this.model)
    this.graph.setConnectable(true)
    this.graph.setMultigraph(false)
    const addVertex = (icon, w, h, style) => {
      const vertex = new MxCell(null, new MxGeometry(0, 0, w, h), style)
      vertex.setVertex(true)
      const img = this.addToolbarItem(this.graph, toolbar, vertex, icon)
      img.enabled = true
      this.graph.getSelectionModel().addListener(MxEvent.CHANGE, () => {
        const tmp = this.graph.isSelectionEmpty()
        MxUtils.setOpacity(img, (tmp) ? 100 : 20)
        img.enabled = tmp
    addVertex('./mxgraph/images/rectangle.gif', 100, 40, '')
    addVertex('./mxgraph/images/rounded.gif', 100, 40, 'shape=rounded')
    addVertex('./mxgraph/images/ellipse.gif', 40, 40, 'shape=ellipse')
    addVertex('./mxgraph/images/rhombus.gif', 40, 40, 'shape=rhombus')
    addVertex('./mxgraph/images/triangle.gif', 40, 40, 'shape=triangle')
    addVertex('./mxgraph/images/cylinder.gif', 40, 40, 'shape=cylinder')
    addVertex('./mxgraph/images/actor.gif', 30, 40, 'shape=actor')
    var doc = MxUtils.parseXml(xml)
    var codec = new MxCodec(doc)
    codec.decode(doc.documentElement, this.graph.getModel())
// xml => json
