|
|
|


作为一个颜控,看到这个问题可谓是非常感兴趣了,在这里推荐两个 比较冷门但绘图效果很棒 的库: Altair 和 GeoViews 。
- Altair
Altair 类似于Seaborn,主要用于 统计可视化, 是一种声明性统计可视化库,是JavaScript的高级可视化库Vega-Lite的包装器。Altair可以画很多种图形,这里主要介绍一下Altair的地图绘制部分。
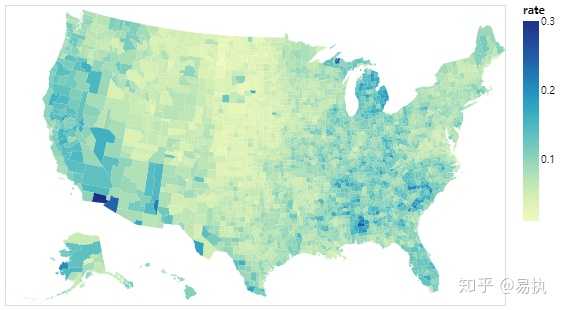
Altair中用简单的代码就可以绘制超级好看的 Choropleth Map(地区分级统计图)
import altair as alt
from vega_datasets import data
counties = alt.topo_feature(data.us_10m.url, 'counties')
source = data.unemployment.url
alt.Chart(counties).mark_geoshape().encode(
    color='rate:Q'
).transform_lookup(
    lookup='id',
    from_=alt.LookupData(source, 'id', ['rate'])
).project(
    type='albersUsa'
).properties(
    width=500,
    height=300
)

Altair中生成带经纬度的世界地图
# Data generators for the background
sphere = alt.sphere()
graticule = alt.graticule()
# Source of land data
source = alt.topo_feature(data.world_110m.url, 'countries')
# Layering and configuring the components
alt.layer(
    alt.Chart(sphere).mark_geoshape(fill='lightblue'),
    alt.Chart(graticule).mark_geoshape(stroke='white', strokeWidth=0.5),
    alt.Chart(source).mark_geoshape(fill='ForestGreen', stroke='ForestGreen')
).project(
    'naturalEarth1'
).properties(width=600, height=400).configure_view(stroke=None)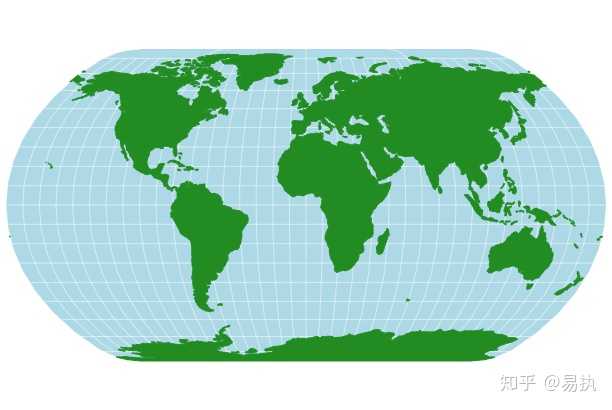

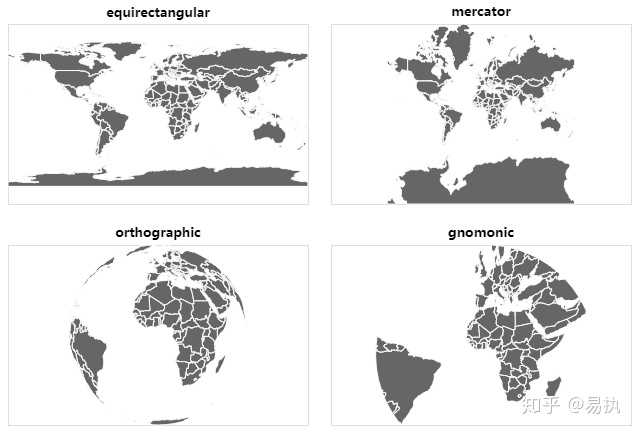
从不同的视角展现世界地图

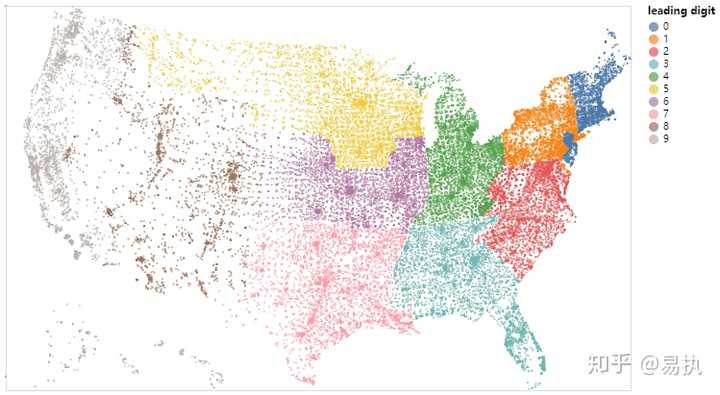
美国的邮编分布图

还能绘制 伦敦地铁线路图
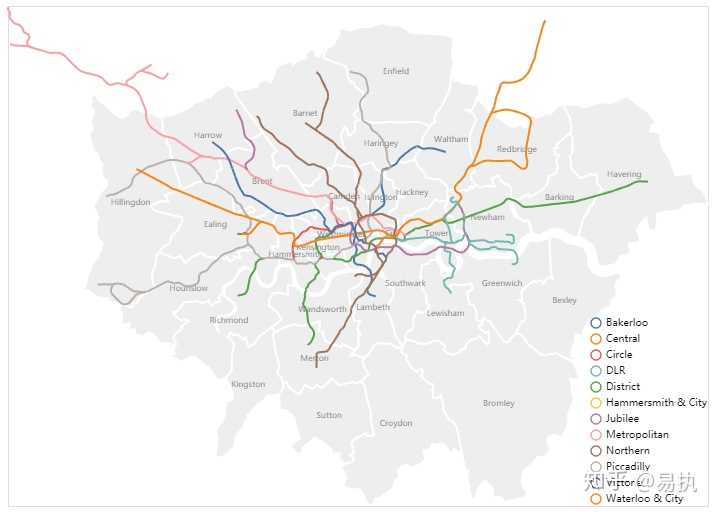
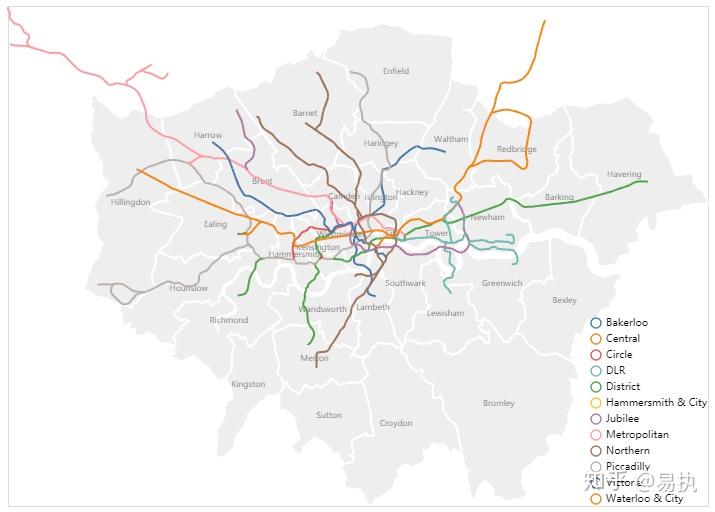
想深入学习的同学可以参见官方文档
- GeoViews
相比Altair而言, GeoViews 更专注于地理数据的可视化。运用GeoViews,可以很容易地对 地理 、 气象 和 海洋 数据集进行探索和可视化,其也常被应用于 天气、气候和遥感 的研究。
GeoView既可以结合bokeh生成动态的地理图,也可以结合matplotlib绘制静态图。
1、绘图呈现 地表温度变化
import geoviews as gv
import geoviews.feature as gf
import xarray as xr
from cartopy import crs
gv.extension('matplotlib')
# Define data
ensemble = xr.open_dataset('../../data/ensemble.nc')
dataset = gv.Dataset(ensemble, ['longitude', 'latitude', 'time'], 'surface_temperature', crs=crs.PlateCarree())
images = dataset.to(gv.Image)
# plot
images.opts(cmap='viridis', colorbar=True, fig_size=250) * gf.coastline

2、英国脱欧公投票数地区分布
geometries = gpd.read_file('../../assets/boundaries/boundaries.shp')