


Python气象绘图笔记(四)——填色与colorbar

以下全文代码均已发布至和鲸社区,点击下面卡片前往,可一键fork跑通
- 所谓填色,其实就是对等高线图进行填充的绘图(没想到合适的表达方式),可以理解为等温图。使用以下代码:
contourf=axe.contourf(lon, lat, f, levels=level, cmap=cmaps.NCV_jaisnd,extend='both')第一个参数是x轴的数据,在气象绘图中也就是经度;第二个参数是y轴的数据,即纬度;第三个是填充数据,可以是温度、湿度、污染物浓度等。这三个参数均可以是一维的也可以是二维的,只要保证数据的尺寸相同即可,并且可以是pandas的列表,也可以是ndarray,也可以是list,xarray,netcdf,使用起来较为方便。
levels可以指定自己所需要的填色范围与两种颜色之间的数值间隔。
cmap可以指定自己需要的配色方案,可以使用matplotlib官方提供的cmap,不过在本系列文章中使用的均是 cmaps库 所提供的的配色,该项目将ncl的配色方案移植到了python库上,比较方便。
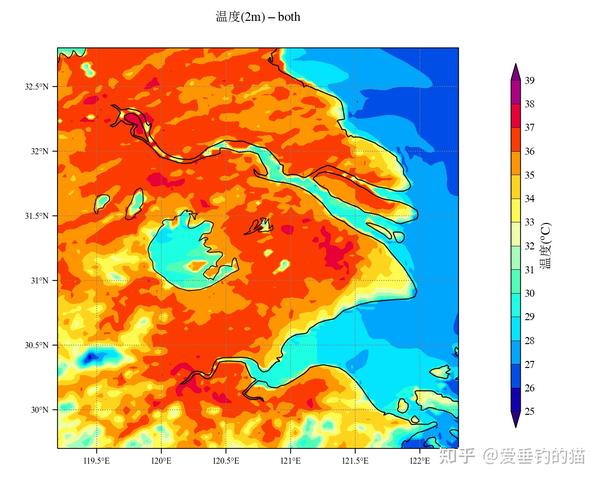
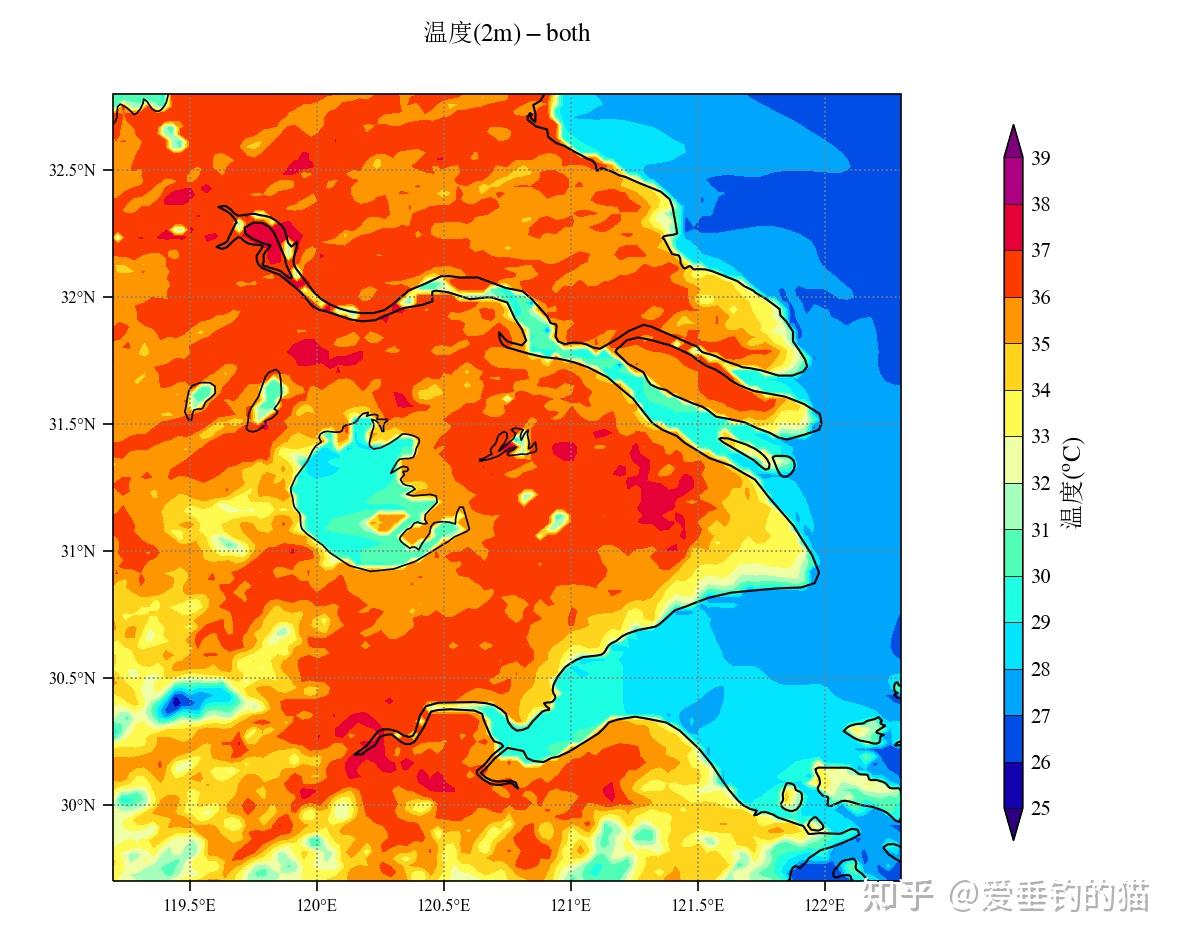
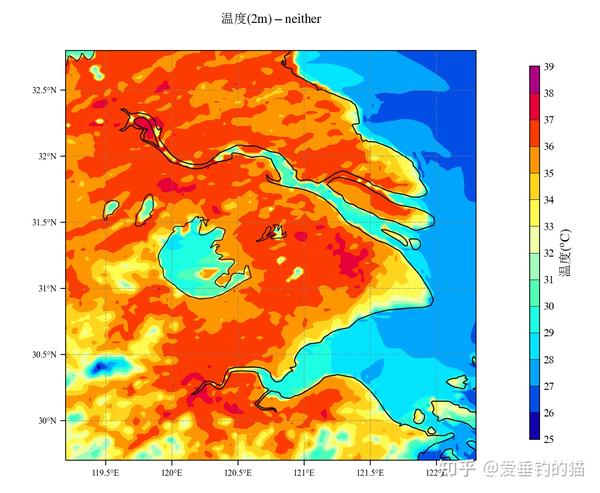
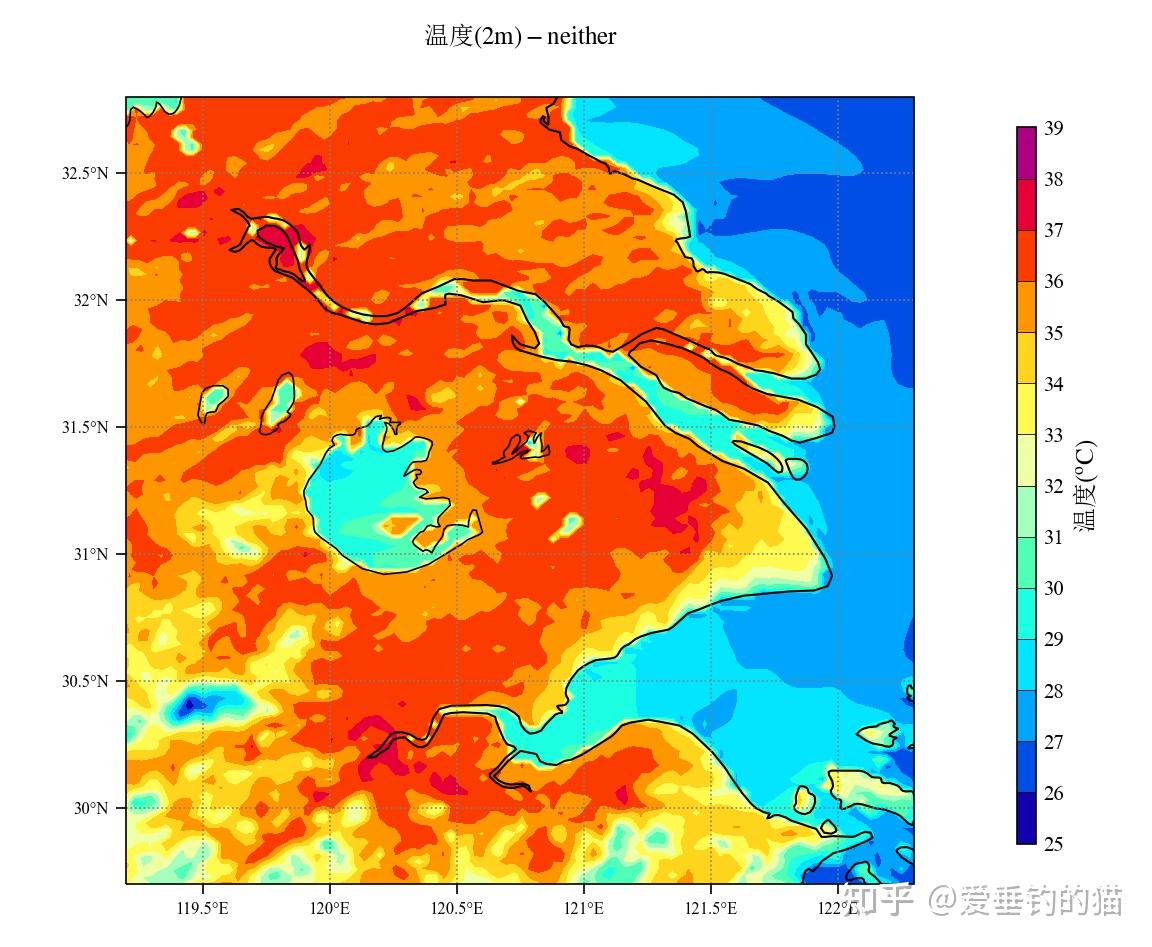
extend参数对填充颜色没有影响,但是会影响到colorbar的绘制。both表示两端尖角显示(ncl绘图默认的形状),neither表示两端平头,max与min分别代表仅最大值与最小值显示尖角。关于colorbar尖角有更多的参数设置,如extendfrac,extendrect等可以设置尖角的大小等参数,均在colorbar()中进行指定,如果需要的话可以参考 官方文档 。
其他更多参数可以参考官方文档。
2. colorbar的简单绘制:
colorbar(contourf, drawedges=True, orientation='vertical',spacing='uniform')其中需要指定绘制colorbar的对象,可以是任何使用了cmap的对象,比如contour、contourf、quiver等。
drawedges表示是否需要在颜色分界处绘制黑色的分割线
orientation与spacing较为容易理解,不赘述了,不清楚的可以参考官方文档。其中orientation支持vertical与horizontal。
使用以上方法的话,matplotlib会自动识别contourf的颜色间隔与大小,自动生成色标尺,并且自动修改其大小。
而需要自定义的话,使用以下代码:
t2_level=np.arange(25,40,1)
rect = [0.78, 0.15, 0.013, 0.7]
cbar_ax = fig.add_axes(rect)
cb = fig.colorbar(contourf, drawedges=True, ticks=t2_level, cax=cbar_ax, orientation='vertical',spacing='uniform')
其中rect的四个参数分别代表colorbar的水平位置,垂直位置,水平宽度,垂直宽度
cbar_ax表示在fig中将colorbar以子图的形式添加至对应位置。
而如果是多个子图,需要对多个子图添加共用colorbar的话,一定要自己指定位置与大小,同时建议需要以下代码:
fig.subplots_adjust(right=0.8)这个代码的作用是在figure将右侧80%的位置留出空白,这样可以保证colorbar不会与绘制的图片重叠。同理也可以对bottom,top,left进行留空。
a. colorbar设置题目:
cb.set_label('温度$\mathrm{(^oC)}$', fontsize=12)b. colorbar设置伸出刻度线的长度:
cb.ax.tick_params(length=2)这里用到的其实就是面向对象的方式,由于colorbar是一个object,因此可以指定其ax(轴)修改指定的参数
c. colorbar修改刻度字体、大小等:
labels=cb.ax.get_xticklabels()+cb.ax.get_yticklabels()
[label.set_fontproperties(FontProperties(fname="./font/Times.ttf",size=10)) for label in labels]
同样的,面向对象的方式。关于这个技巧的详细介绍,可以参考该文章:
接下来完整的图片绘制,首先代码如下:
import matplotlib.pyplot as plt
import numpy as np
import netCDF4 as nc
from matplotlib.font_manager import FontProperties
from cartopy.mpl.ticker import LongitudeFormatter, LatitudeFormatter
from cartopy.mpl.gridliner import LONGITUDE_FORMATTER, LATITUDE_FORMATTER
import matplotlib.ticker as mticker
import matplotlib as mpl
import cartopy.crs as ccrs
import cartopy.feature as cfeat
from wrf import getvar, to_np
import cmaps
Simsun = FontProperties(fname="./font/SimSun.ttf")
Times = FontProperties(fname="./font/Times.ttf")
config = {
"font.family":'serif',
"mathtext.fontset": 'stix',
"font.serif": ['SimSun'],
mpl.rcParams.update(config)
mpl.rcParams['axes.unicode_minus']=False
fig=plt.figure(figsize=(5,5),dpi=150)
axe=plt.subplot(1,2,1,projection=ccrs.PlateCarree())
axe.set_title('温度$\mathrm{(2m)}$',fontsize=12,y=1.05)
axe.add_feature(cfeat.COASTLINE.with_scale('10m'), linewidth=1,color='k')
LAKES_border = cfeat.NaturalEarthFeature('physical', 'lakes', '10m', edgecolor='k', facecolor='never')
axe.add_feature(LAKES_border, linewidth=0.8)
axe.set_extent([119.2,122.3, 29.7, 32.8], crs=ccrs.PlateCarree())
gl = axe.gridlines(crs=ccrs.PlateCarree(), draw_labels=True, linewidth=0.8, color='gray',linestyle=':')
gl.top_labels,gl.bottom_labels,gl.right_labels,gl.left_labels = False,False,False,False
gl.xlocator = mticker.FixedLocator(np.arange(119.5, 122.1, 0.5))
gl.ylocator = mticker.FixedLocator(np.arange(30, 32.6, 0.5))
axe.set_xticks(np.arange(119.5, 122.1, 0.5), crs=ccrs.PlateCarree())
axe.set_yticks(np.arange(30, 32.6, 0.5), crs=ccrs.PlateCarree())
axe.xaxis.set_major_formatter(LongitudeFormatter())
axe.yaxis.set_major_formatter(LatitudeFormatter())
axe.tick_params(labelcolor='k',length=5)
labels = axe.get_xticklabels() + axe.get_yticklabels()
[label.set_fontproperties(FontProperties(fname="./font/Times.ttf",size=8)) for label in labels]
axe2=plt.subplot(1,2,2,projection=ccrs.PlateCarree())
axe2.set_title('温度$\mathrm{(2m)}$',fontsize=12,y=1.05)
axe2.add_feature(cfeat.COASTLINE.with_scale('10m'), linewidth=1,color='k')
LAKES_border = cfeat.NaturalEarthFeature('physical', 'lakes', '10m', edgecolor='k', facecolor='never')
axe2.add_feature(LAKES_border, linewidth=0.8)
axe2.set_extent([119.2,122.3, 29.7, 32.8], crs=ccrs.PlateCarree())
gl = axe2.gridlines(crs=ccrs.PlateCarree(), draw_labels=True, linewidth=0.8, color='gray',linestyle=':')
gl.top_labels,gl.bottom_labels,gl.right_labels,gl.left_labels = False,False,False,False
gl.xlocator = mticker.FixedLocator(np.arange(119.5, 122.1, 0.5))
gl.ylocator = mticker.FixedLocator(np.arange(30, 32.6, 0.5))
axe2.set_xticks(np.arange(119.5, 122.1, 0.5), crs=ccrs.PlateCarree())
axe2.set_yticks(np.arange(30, 32.6, 0.5), crs=ccrs.PlateCarree())
axe2.xaxis.set_major_formatter(LongitudeFormatter())
axe2.yaxis.set_major_formatter(LatitudeFormatter())
axe2.tick_params(labelcolor='k',length=5)
labels = axe2.get_xticklabels() + axe2.get_yticklabels()
[label.set_fontproperties(FontProperties(fname="./font/Times.ttf",size=8)) for label in labels]
ncfile=nc.Dataset('D:\wrf_simulation\\2meic\\wrfout_d03_2016-07-21_12_2meic')
t2=getvar(ncfile,'T2',timeidx=126)
t2=t2-273.15
t22=getvar(ncfile,'T2',timeidx=138)
t22=t22-273.15
lat=getvar(ncfile,'lat')
lon=getvar(ncfile,'lon')
t2_level=np.arange(25,40,1)
contourf = axe.contourf(lon, lat, t2, levels=t2_level, cmap=cmaps.NCV_jaisnd,extend='both')
contourf2 = axe2.contourf(lon, lat, t22, levels=t2_level, cmap=cmaps.NCV_jaisnd,extend='both')
fig.subplots_adjust(right=0.7)
rect = [0.78, 0.25, 0.01, 0.5]
cbar_ax = fig.add_axes(rect)
cb = fig.colorbar(contourf, drawedges=True, ticks=t2_level, cax=cbar_ax, orientation='vertical',spacing='uniform')
cb.set_label('温度$\mathrm{(^oC)}$', fontsize=12)
cb.ax.tick_params(length=0)
labels=cb.ax.get_xticklabels()+cb.ax.get_yticklabels()