


GIS开发_OpenLayers教程
一、介绍
OpenLayers 是一个专为Web GIS 客户端开发提供的JavaScript 类库包,用于实现标准格式发布的地图数据访问。从OpenLayers2.2版本以后,OpenLayers已经将所用到的Prototype.js组件整合到了自身当中,并不断在Prototype.js的基础上完善面向对象的开发,Rico用到地方不多,只是在OpenLayers.Popup.AnchoredBubble类中圆角化DIV。
官网地址: https:// openlayers.org/
特征
- 支持平铺层:从OSM,Bing,MapBox,Stamen和您可以找到的任何其他XYZ源中拉出图块。还支持OGC映射服务和分层图层。
- 支持矢量层:渲染来自GeoJSON,TopoJSON,KML,GML,Mapbox矢量图块和其他格式的矢量数据。
- 运用先进技术:利用Canvas 2D,WebGL和HTML5的所有最新功能。开箱即用的移动支持。仅使用所需组件构建轻量级定制概要文件。
- 易于定制和扩展:使用简单的CSS样式化地图控件。连接到不同级别的API或使用第三方库自定义和扩展功能。
二、快速入门
1、官网快速入门案例
新建个html文件,将下述代码粘贴保存:
<!doctype html>
<html lang="en">
<link rel="stylesheet" href="https://cdn.jsdelivr.net/gh/openlayers/openlayers.github.io@master/en/v6.5.0/css/ol.css" type="text/css">
<style>
.map {
height: 400px;
width: 100%;
</style>
<script src="https://cdn.jsdelivr.net/gh/openlayers/openlayers.github.io@master/en/v6.5.0/build/ol.js"></script>
<title>OpenLayers example</title>
</head>
<h2>My Map</h2>
<div id="map" class="map"></div>
<script type="text/javascript">
var map = new ol.Map({
target: 'map',
layers: [
new ol.layer.Tile({
source: new ol.source.OSM()
view: new ol.View({
center: ol.proj.fromLonLat([37.41, 8.82]),
zoom: 4
</script>
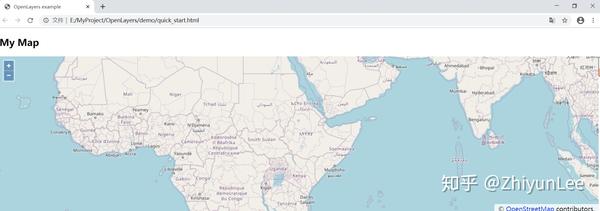
</body>
</html>通过浏览器预览效果,这就是OpenLayers的地图:

注意,这时候两个关键文件
ol.css
和
ol.js
<link rel="stylesheet" href="https://cdn.jsdelivr.net/gh/openlayers/openlayers.github.io@master/en/v6.5.0/css/ol.css" type="text/css">
<script src="https://cdn.jsdelivr.net/gh/openlayers/openlayers.github.io@master/en/v6.5.0/build/ol.js"></script>
2、手动快速入门
上面是官网提供的案例,他的
ol.css
和
ol.js
两个文件都是放在网上的,而现在我们到官网去下载源文件。
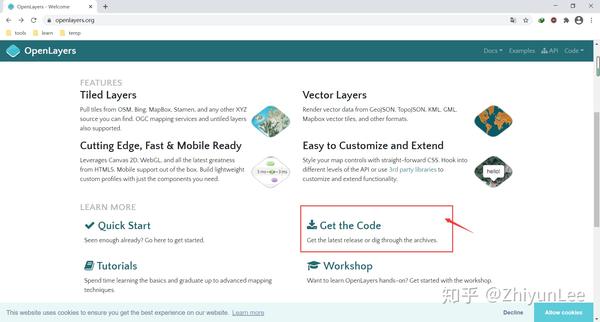
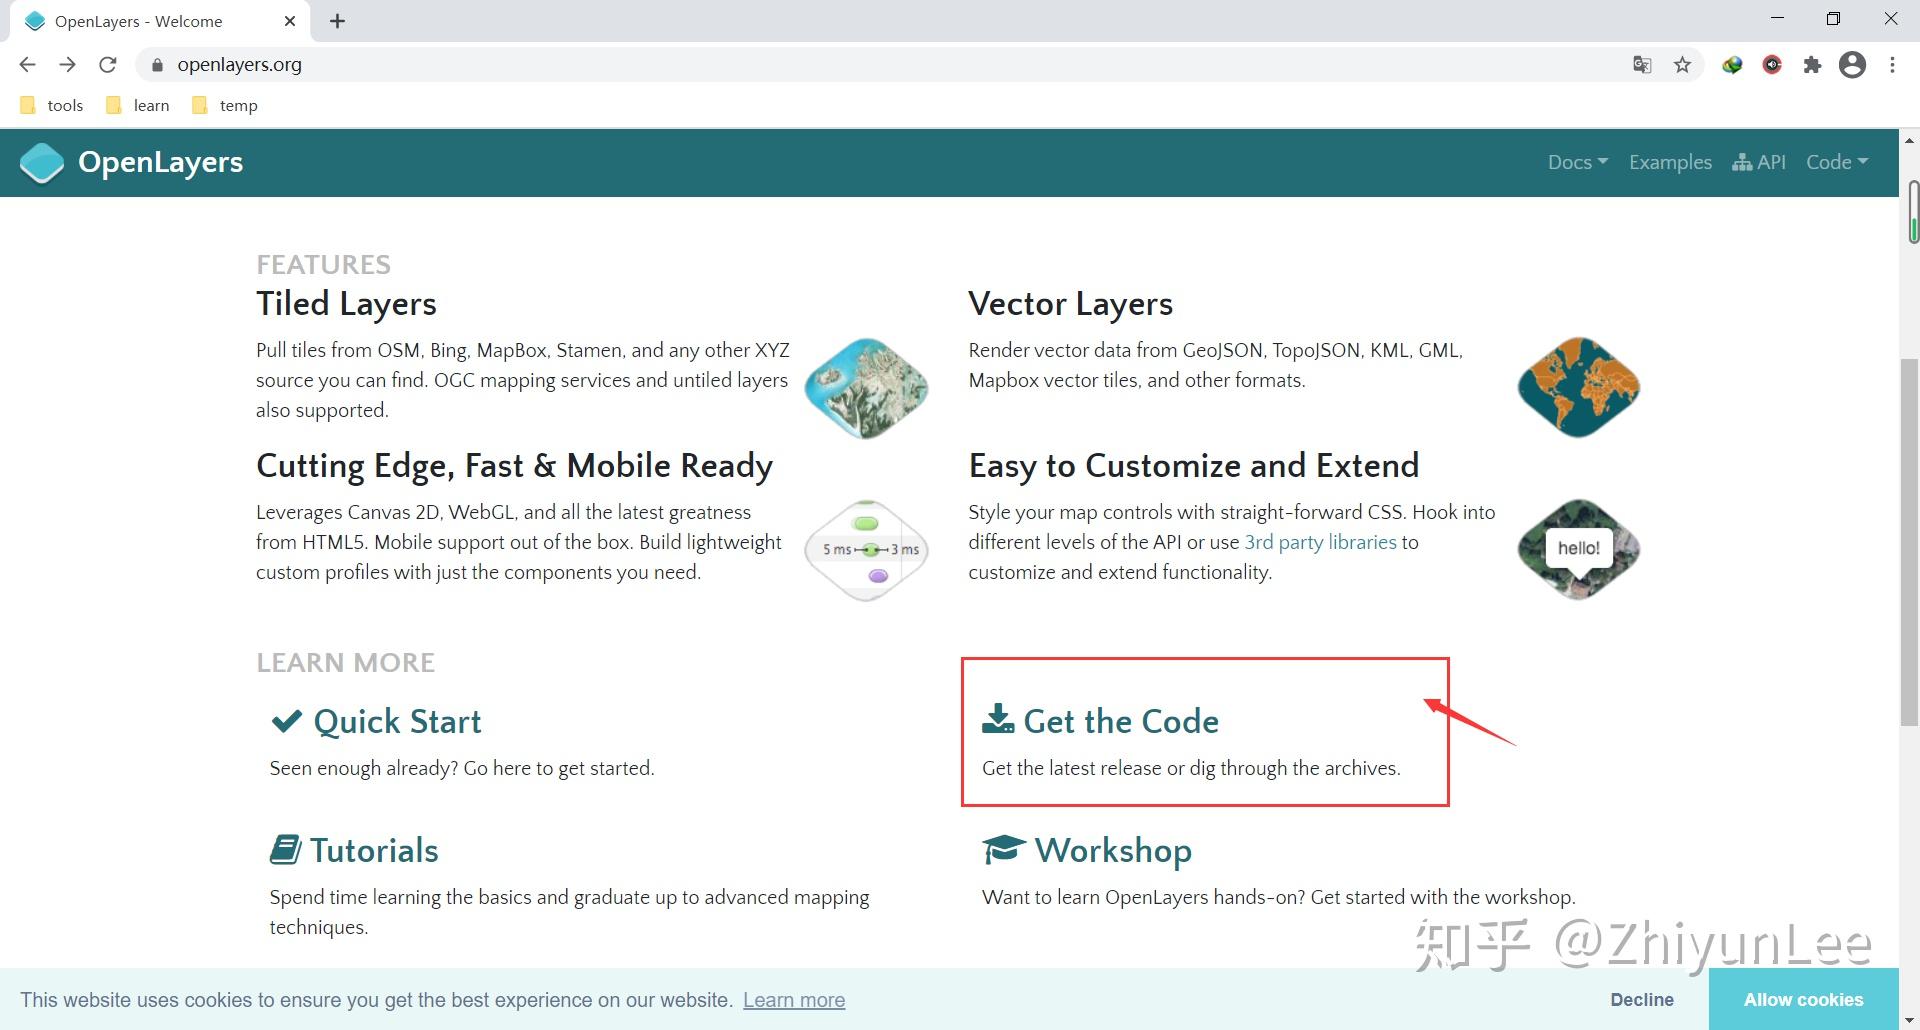
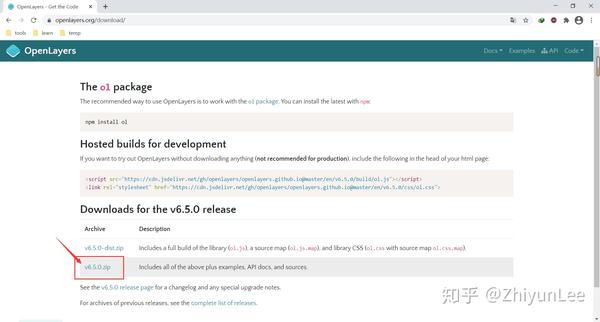
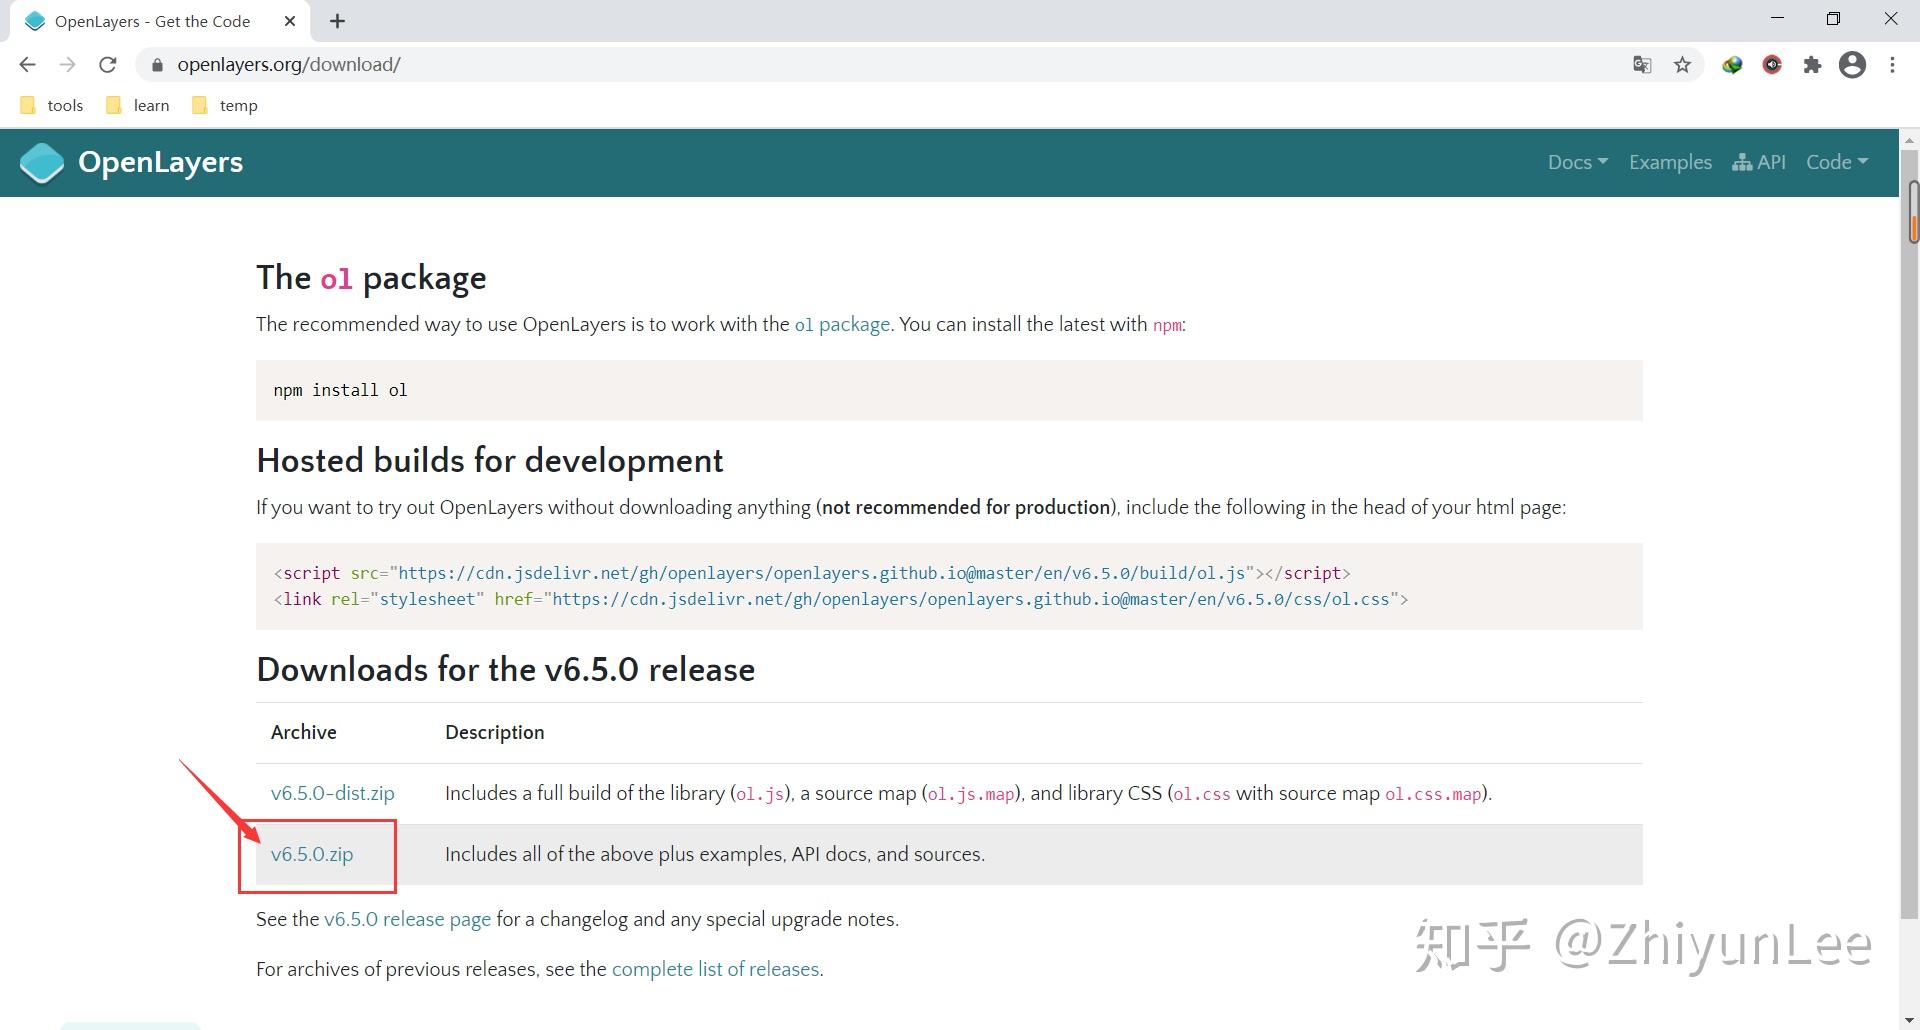
输入网址,进入官网:
https:// openlayers.org/
找到
Get the Code
菜单,下载代码。
选择最新版本v6.5.0版本的压缩包
v6.5.0.zip
。
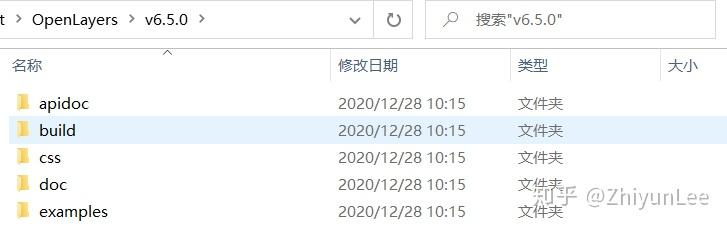
将文件解压到本地,
ol.css
在
css文件夹
内,
ol.js
在
build
文件夹内。

在解压文件夹的同级目录,创建一个html文件粘贴下述代码,引入下载的
ol.css
和
ol.js
,注意路径问题。
<!DOCTYPE html>
<html lang="en">
    <meta charset="UTF-8">
    <meta name="viewport" content="width=device-width, initial-scale=1.0">
    <meta http-equiv="X-UA-Compatible" content="ie=edge">
    <title>Simple Map</title>
    <link rel="stylesheet" href="../v6.5.0/css/ol.css" />
    <script src="../v6.5.0/build/ol.js"></script>
    <style>
      #map {
        height: 400px;
        width: 100%;
    </style>
</head>
    <div id="map"></div>
    <script>
        let map = new ol.Map({
            target: 'map',
            layers: [
                new ol.layer.Tile({
                    source: new ol.source.OSM()
            view: new ol.View({
                projection: 'EPSG:4326',
                center: [0, 0],
                zoom: 0
    </script>
</body>
</html>
3、元素组织结构
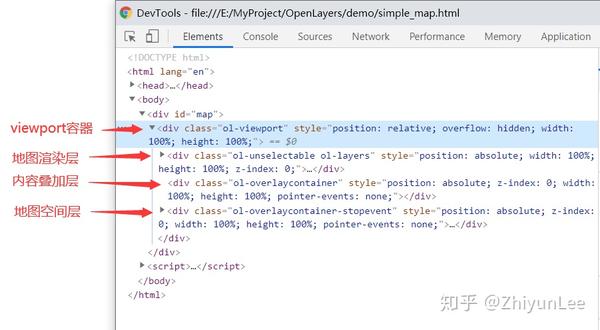


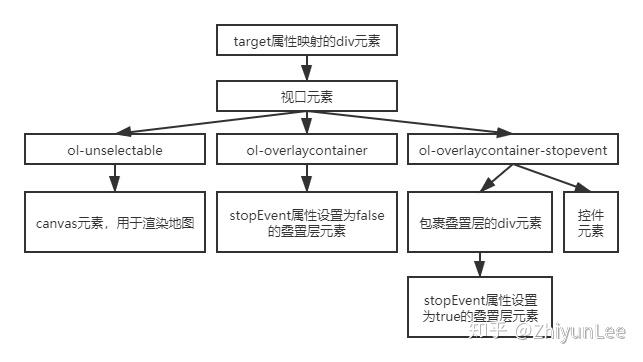
OpenLayers在自定义的div元素(id为map的div元素)中创建了一个viewport容器,这里存放着所有地图相关元素。
- 地图渲染层:用于存放canvas元素,而地图是基于canvas 2D方式渲染
- 内容叠加层:用于放置叠置层内容,如在地图上添加弹窗、图片等等
- 地图控件层:用于放置地图控件,如缩放控件、旋转控件等等
4、修改控件样式
OpenLayers为承载控件的各个DOM元素都自动设置了类名,或者在创建构造方法时设置变量
target
,都可以通过CSS的类选择符就可以修改指定的控件样式。
例如:
<style>
    #map {
        height: 400px;
        width: 100%;
    #map .ol-zoom-in, #map .ol-zoom-out {
        background-color: white;
        color: black;
    #map .ol-zoom-extent button {
        color: blue;
    #map .ol-zoomslider {
        background-color: gray;
    #map .ol-zoomslider button{
        background-color: black;
</style>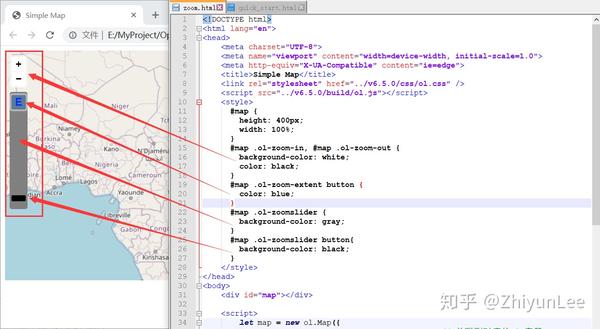

三、控件
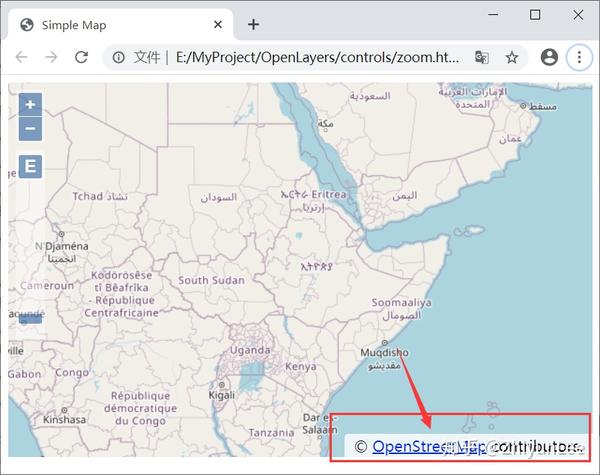
1、归属控件
ol/control/Attribution~Attribution
,用于展示地图资源的版权或者归属,该控件是地图的默认控件之一。
代码:
<script>
// 创建归属控件
let attribution = new ol.control.Attribution({
// 设置属性为不折叠
collapsible: false,
let map = new ol.Map({
target: 'map',
layers: [...],
view: ...,
controls: ol.control.defaults({
// 去掉默认归属控件
attribution: false}).extend([
// 添加归属控件
attribution
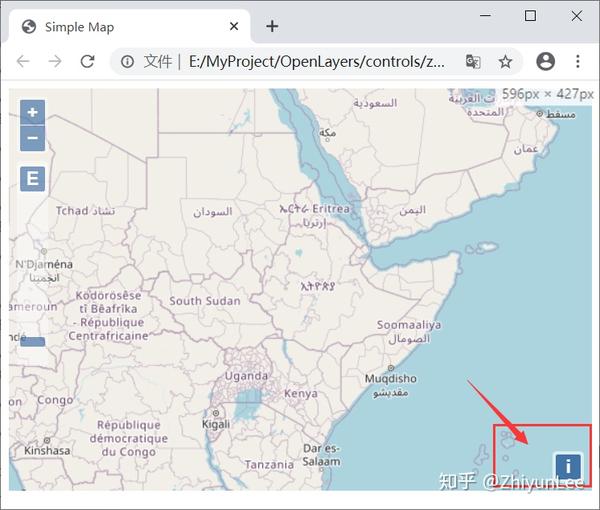
// 根据窗口宽度来设置归属控件是否折叠
function checkSize() {
// 小于600像素折叠,否则不折叠
var small = map.getSize()[0] < 600;
attribution.setCollapsible(small);
attribution.setCollapsed(small);
// 监听窗口变化事件
window.addEventListener('resize', checkSize);
checkSize();
</script>效果:


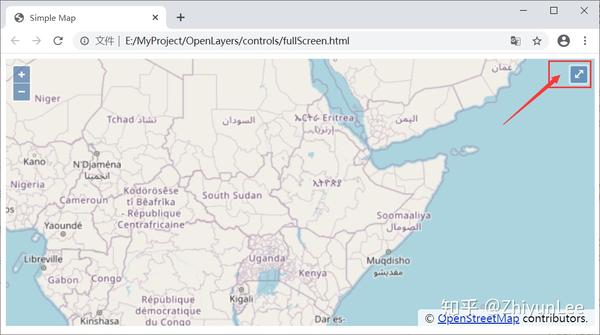
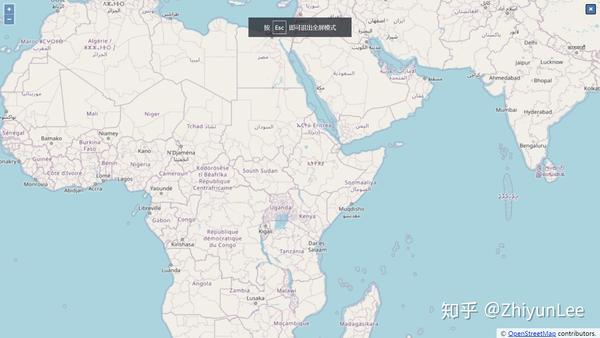
2、全屏控件
ol/control/FullScreen~FullScreen
,在右上角生成一个全屏按钮,点击进行地图全屏。
代码:
<script>
    let map = new ol.Map({
        target: 'map',
        layers: [...],
        view: ...,
        controls: ol.control.defaults().extend([
            // 添加全屏控件
            new ol.control.FullScreen()
</script>
效果:


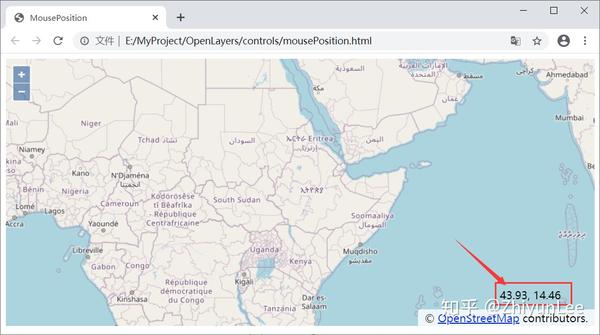
3、坐标拾取控件
ol/control/MousePosition~MousePosition
,实时获取鼠标光标指示处的对应坐标。
代码:
<style>
// 设置拾取坐标位置
.custom-mouse-position {
width:130px;
height: auto;
position:fixed;
bottom: 50px;
right: 20px;
z-index: 1;
</style>
<script>
// 创建坐标拾取控件
let mousePositionControl = new ol.control.MousePosition({
// 字符串格式为:保留小数点后两位
coordinateFormat: new ol.coordinate.createStringXY(2),
// 设置WGS84坐标系
projection: 'EPSG:4326',
// 设置类名称,方便使用css修改
className: 'custom-mouse-position',
// 鼠标离开地图后使用空格代替
undefinedHTML: ' ',
let map = new ol.Map({
target: 'map',
layers: [...],
view: ...,
controls: ol.control.defaults().extend([
// 添加坐标拾取控件
mousePositionControl
</script>效果:

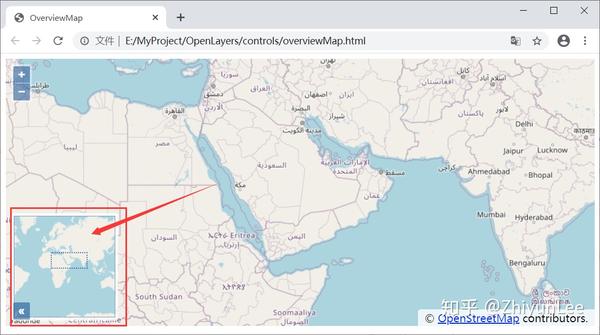
4、鹰眼控件
ol/control/OverviewMap~OverviewMap
,通过小地图更宏观地展示地图位置。
代码:
<script>
    // 创建鹰眼控件
    let overviewMapControl = new ol.control.OverviewMap({
        layers: [
            new ol.layer.Tile({
                source: new ol.source.OSM()
    let map = new ol.Map({
        target: 'map',
        layers: [...],
        view: ...,
        controls: ol.control.defaults().extend([
            // 添加鹰眼控件
            overviewMapControl
</script>
效果:

5、旋转控件
ol/control/Rotate~Rotate
,旋转地图方位,该控件是地图的默认控件之一。
代码:
<script>
    let map = new ol.Map({
        target: 'map',
        layers: [...],
        view: ...,
        // 添加拖拽+旋转+缩放控件
        interactions: ol.interaction.defaults().extend([new ol.interaction.DragRotateAndZoom()])
</script>
效果:
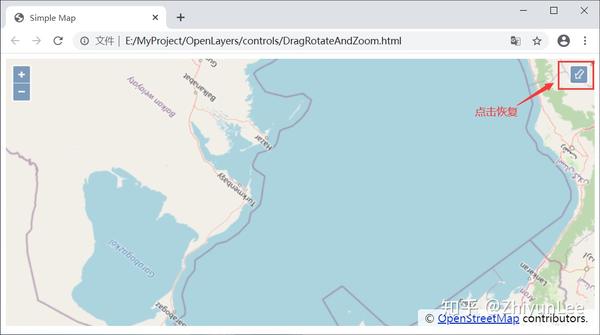

Shift + 鼠标拖动:地图缩放
Shift + Alt + 鼠标拖动:地图旋转
右上角按钮,可以让地图回复原始角度
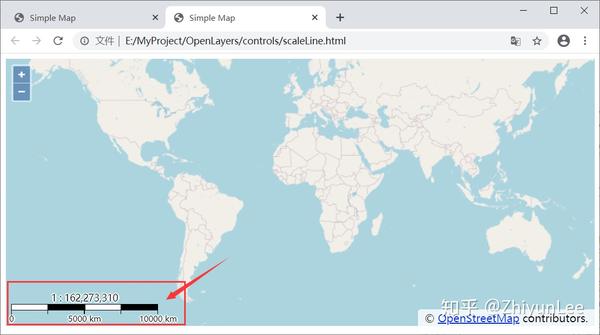
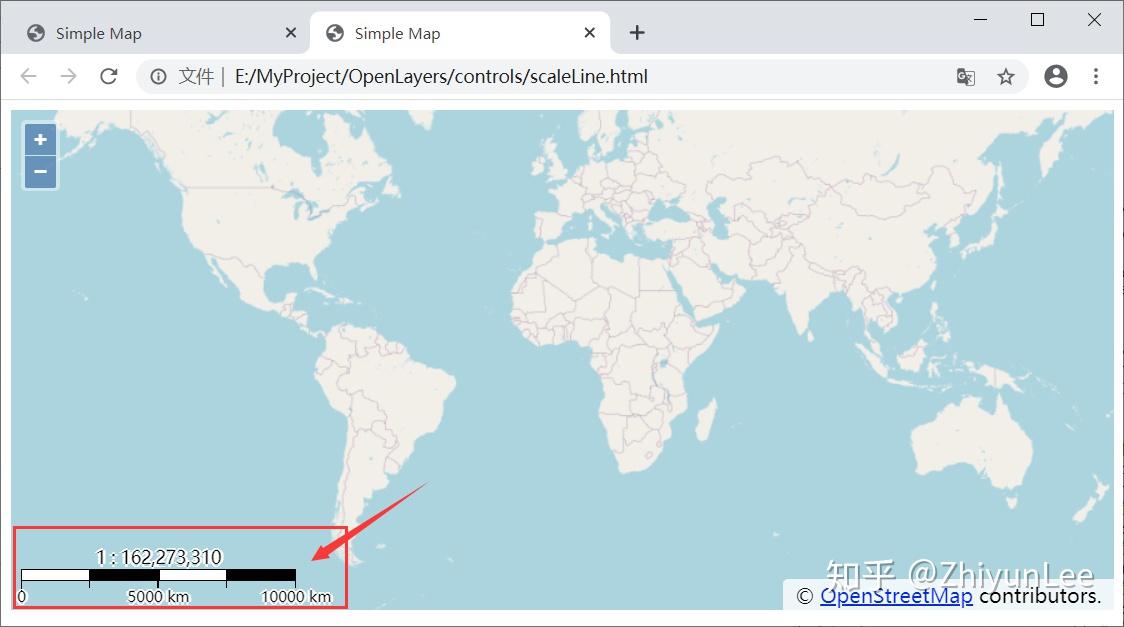
6、比例尺控件
ol/control/ScaleLine~ScaleLine
,展示地图上的线段长度与实地相应线段经水平投影的长度之比。
代码:
<script>
let map = new ol.Map({
target: 'map',
layers: [...],
view: ...,
// 添加标尺控件
controls: ol.control.defaults
().extend([
new ol.control.ScaleLine({
// 设置单位
units: 'metric',
// 设置比例尺
bar: true,
// 设置比例尺步数
steps: 4,
// 设置比例尺上方渲染文本比例
text: true,
// 设置最小像素宽度
minWidth: 140
</script>效果:
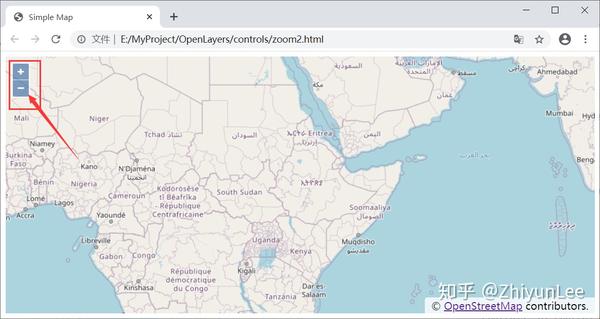
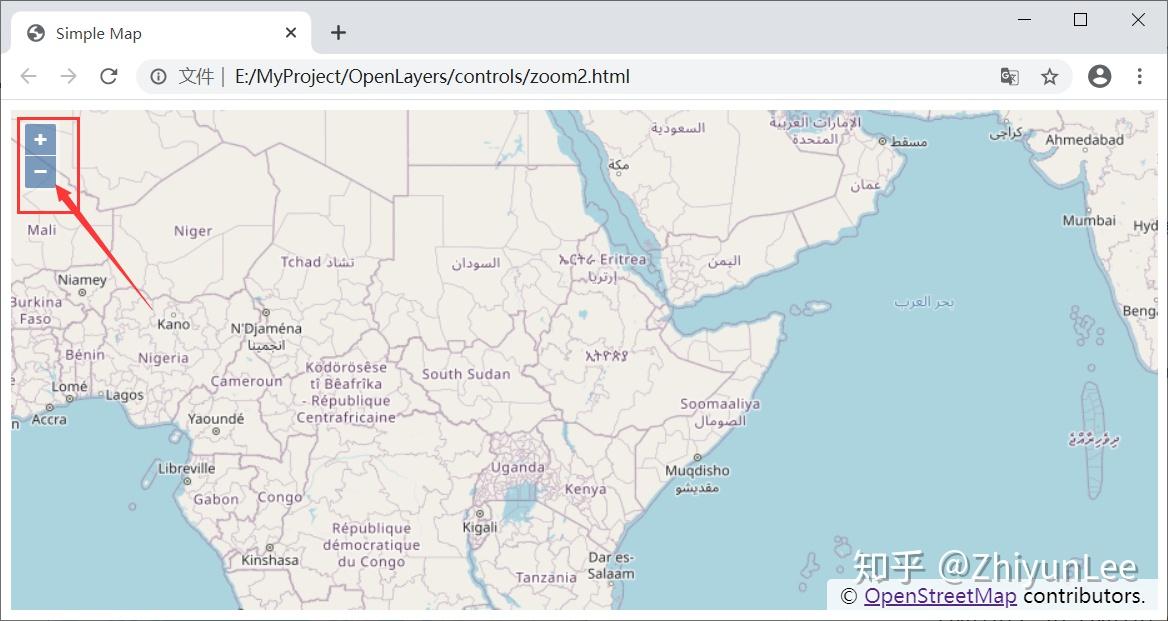
7、缩放控件
ol/control/Zoom~Zoom
,采用
+
、
-
两个按钮进行地图的缩放功能,该控件是地图的默认控件之一。
代码:
<script>
     let map = new ol.Map({
         target: 'map',
         layers: [...],
         view: ...,
	     controls: ol.control.defaults({
                  // 去掉默认缩放控件
                  zoom:false}).extend([
            // 添加缩放控件
			new ol.control.Zoom()
</script>
效果:
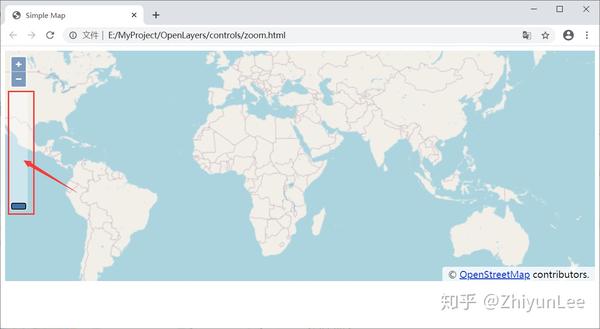
8、缩放滑块控件
ol/control/ZoomSlider~ZoomSlider
,采用滑块的方式进行地图的缩放功能。
代码:
<script>
     let map = new ol.Map({
         target: 'map',
         layers: [...],
         view: ...,
	     controls: ol.control.defaults().extend([
            // 添加缩放滑块控件
			new ol.control.ZoomSlider()
</script>
效果:

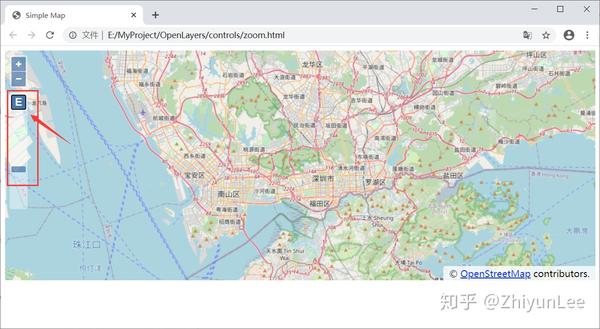
9、缩放跳转控件
ol/control/ZoomToExtent~ZoomToExtent
,在地图上出现一个按钮,点击会跳转至设定的视图界面。
代码:
<script>
     let map = new ol.Map({
         target: 'map',
         layers: [...],
         view: ...,
	     controls: ol.control.defaults().extend([
            // 添加缩放跳转控件
			new ol.control.ZoomToExtent({
				extent: [
					12667718, 2562800,
                    12718359, 2597725
</script>
extent
:表示地图视图的缩放位置,赋值参数为一个数组,前两个数字表示地图左下角坐标,后两个数字表示地图右上角坐标。
效果:

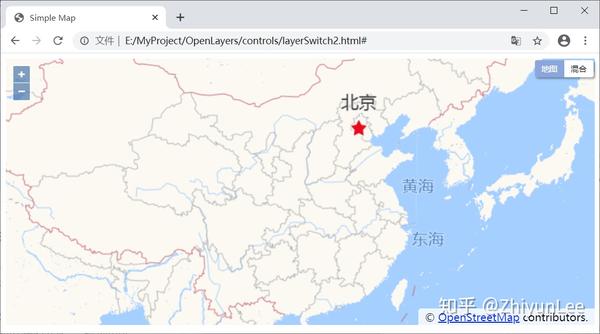
四、功能
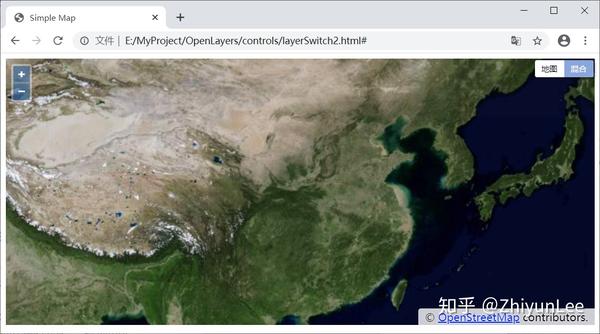
1、图层切换
模拟高德地图进行图层切换,分别由普通模式和混合模式。
代码:
<body>
<div id="map"></div>
<div class="mapSwitch">
<a href="#" class="normal active">地图</a>
<a href="#" class="mix">混合</a>
</div>
<script>
let map = new ol.Map({
target: 'map',
layers: [
new ol.layer.Tile({
source: new ol.source.XYZ({
crossOrigin: 'Anonymous',
// 高德普通地图
url:'http://webrd03.is.autonavi.com/appmaptile?x={x}&y={y}&z={z}&lang=zh_cn&size=1&scale=1&style=8'
visible: true
new ol.layer.Tile({
source: new ol.source.XYZ({
crossOrigin: 'Anonymous',
// 高德混合地图
url:'http://webst02.is.autonavi.com/appmaptile?style=6&x={x}&y={y}&z={z}'
visible: false
vectorLayer
view: ...
// 设置点击事件
$('.normal').click(function () {
if (!$(this).hasClass('active')) {
$(this).addClass('active').siblings().removeClass('active');
map.getLayers().item(1).setVisible(false);
map.getLayers().item(0).setVisible(true);
$('.mix').click(function () {
if (!$
(this).hasClass('active')) {
$(this).addClass('active').siblings().removeClass('active');
map.getLayers().item(0).setVisible(false);
map.getLayers().item(1).setVisible(true);
</script>
</body>效果:


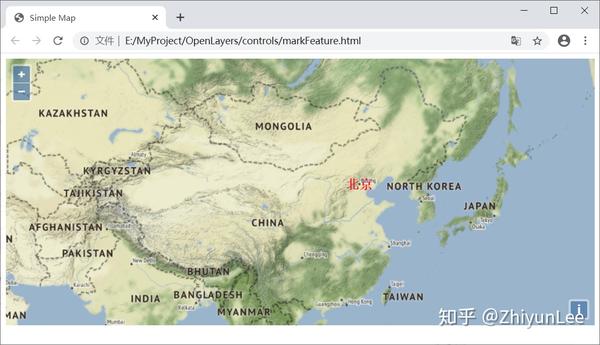
2、地图标注
地图标注是将空间位置点与该点的信息相关联,通过图标、文字等形式把点相关的信息展现到地图上。
地图标注的表现形式多样,包括简单的图片标注,文字标注,图文标注等。
使用Feature实现标注
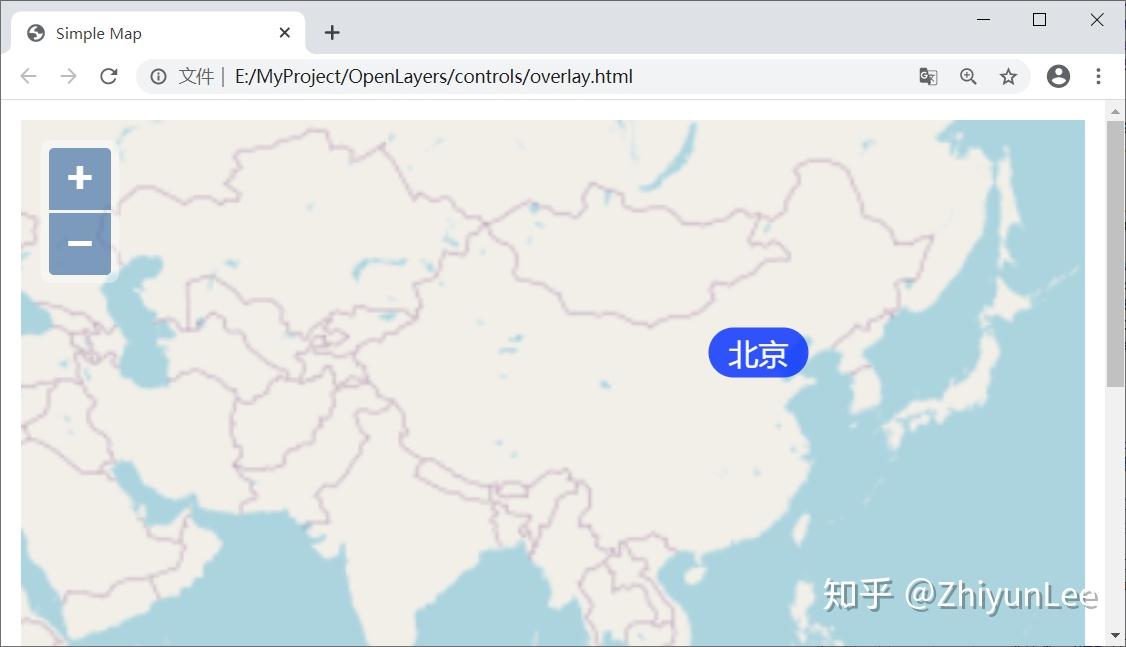
文字标注
<script>
    // 设置标注样式
    let labelStyle = new ol.style.Style({
        text: new ol.style.Text({
            font: 'bold 20px serif',
            text: '北京',
            fill: new ol.style.Fill({
                color: 'rgba(255, 0, 0, 1)'
    // 创建矢量源
    let vectorSource = new ol.source.Vector();
    // 创建矢量图层
    let vectorLayer = new ol.layer.Vector({
        source: vectorSource
    // 用于充当标注的要素
    let labelFeature = new ol.Feature({
        geometry: new ol.geom.Point([12956325, 4851028])
    // 添加标注的样式
    labelFeature.setStyle(labelStyle);
    // 将标注要素添加到矢量图层中
    vectorSource.addFeature(labelFeature);
    let map = new ol.Map({
        target: 'map',
        layers: [
            // 平铺层
            new ol.layer.Tile({
                source: new ol.source.OSM()
            // 矢量层
            vectorLayer
        view: ...
</script>
效果:

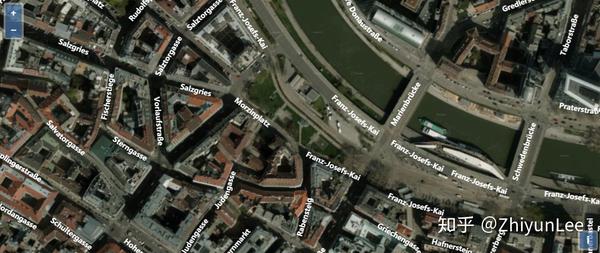
街道标注
代码:
<script>
// 设置标注样式
let labelStyle = new ol.style.Style({
text: new ol.style.Text({
font: 'bold 11px "Open Sans", "Arial Unicode MS", "sans-serif"',
placement: 'line',
fill: new ol.style.Fill({
color: 'white'
var key = 'Get your own API key at https://www.maptiler.com/cloud/';
var attributions =
'<a href="https://www.maptiler.com/copyright/" target="_blank">© MapTiler</a> ' +
'<a href="https://www.openstreetmap.org/copyright" target="_blank">© OpenStreetMap contributors</a>';
var viewExtent = [1817379, 6139595, 1827851, 6143616];
let map = new ol.Map({
target: 'map',
layers: [
new ol.layer.Tile({
source: new ol.source.XYZ({
attributions: attributions,
url: 'https://api.maptiler.com/tiles/satellite/{z}/{x}/{y}.jpg?key=' + key,
maxZoom: 20,
// 加载部分街道数据
new ol.layer.Vector({
declutter: true,
source: new ol.source.Vector({
format: new ol.format.GeoJSON(),
url: 'data/geojson/vienna-streets.geojson',
style: function (feature) {
style.getText().setText(feature.get('name'));
return style;
view:...
</script>效果:

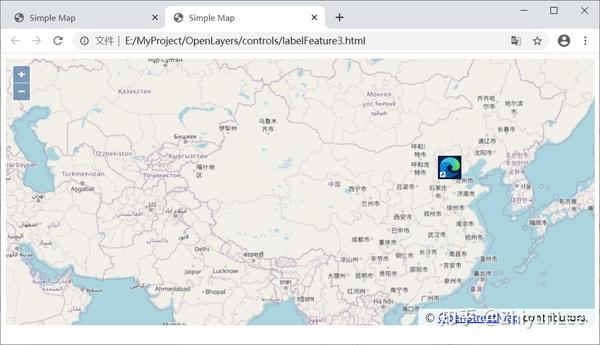
图片标注
代码:
<script>
let vectorSource = new ol.source.Vector;
let vectorLayer = new ol.layer.Vector({
source: vectorSource
// 设置标注样式
let labelStyle = new ol.style.Style({
image: new ol.style.Icon({
src: 'icon.png',
scale
: 0.5
// 用于充当标注的要素
let labelFeature = new ol.Feature({
geometry: new ol.geom.Point([12956325, 4851028])
// 添加标注的样式
labelFeature.setStyle(labelStyle);
// 将标注要素添加到矢量图层中
vectorSource.addFeature(labelFeature);
let map = new ol.Map({
target: 'map',
layers: [
new ol.layer.Tile({
source: new ol.source.OSM()
vectorLayer
view: ...
</script>效果:

使用Overlay实现标注
ol.Overlay类主要用于实现弹窗功能,但是它也能用于实现标注。
代码:
<body>
	<div id="map"></div>
	<button id="icon">北京</button>
    <script>
        let map = new ol.Map({
            target: 'map',
            layers: [...],
            view: ...
		let marker = new ol.Overlay({
			// 标注位置
			position: ol.proj.fromLonLat([116.435889, 39.911393]),
			// 标注相对与锚点的方位
			positioning: 'center-center',
			// 充当标注的DOM元素
			element: document.getElementById("icon")
		map.addOverlay(marker);
    </script>
</body>
效果:

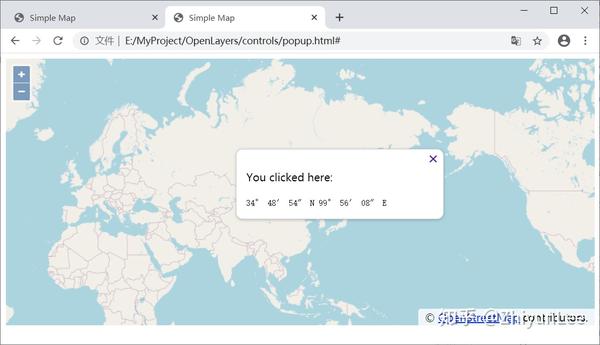
3、弹窗
在OpenLayers中弹窗使用 ol.Overlay 类来实现,它的原理是将DOM元素动态地移动并覆盖到地图中的指定位置,因此也叫叠置层。
代码:
<style>
    #map {
        height: 400px;
        width: 100%;
    .ol-popup {
        position: absolute;
        background-color: white;
        box-shadow: 0 1px 4px rgba(0,0,0,0.2);
        padding: 15px;
        border-radius: 10px;
        border: 1px solid #cccccc;
        bottom: 12px;
        left: -50px;
        min-width: 280px;
    .ol-popup-closer {
        text-decoration: none;
        position: absolute;
        top: 2px;
        right: 8px;
</style>
	<div id="map"></div>
	<div id="popup" class="ol-popup">
		<a href="#" id="popup-closer" class="ol-popup-closer">✖</a>
		<div id="popup-content"></div>
	</div>
    <script>
		// 获取弹窗元素
		let container = document.getElementById('popup');
		let content = document.getElementById('popup-content');
		let closer = document.getElementById('popup-closer');
		// 创建图层用于定位弹窗
		let overlay = new ol.Overlay({
			element: container,
			autoPan: true,
			autoPanAnimation: {
				duration: 250
		// 绑定关闭按钮事件
		closer.onclick = function() {
			overlay.setPosition(undefined);
			closer.blur();
			return false;
        let map = new ol.Map({
            target: 'map',
            layers: [...],
            view: ...,
			// 添加图层
			overlays: [overlay]
		// 绑定地图点击事件
		map.on('singleclick', function(evt) {
			let coordinate = evt.coordinate;
			let hdms = ol.coordinate.toStringHDMS(ol.proj.toLonLat(coordinate));
			content.innerHTML = '<p>You clicked here:</p><code>' + hdms + '</code>';
			overlay.setPosition(coordinate);
    </script>
</body>
效果:

4、绘图
代码:
<body>
<div id="map"></
div>
<label>Shape type </label>
<select id="type">
<option value="Point">Point</option>
<option value="LineString">LineString</option>
<option value="Polygon">Polygon</option>
<option value="Circle">Circle</option>
<option value="Square">Square</option>
<option value="Box">Box</option>
<option value="None">None</option>
</select>
<script>
let vectorSource = new ol.source.Vector();
let vectorLayer = new ol.layer.Vector({
source: vectorSource
let map = new ol.Map({
target: 'map',
layers: [
new ol.layer.Tile({
source: new ol.source.OSM()
vectorLayer
view: ...
let typeSelect = document.getElementById('type');
let draw;
function addInteraction() {
let type = typeSelect.value;
if (type !== 'None') {
let geometryFunction;
switch(type) {
case "Square":
type = 'Circle';
// 生成规则四边形的图形函数
geometryFunction = ol.interaction.Draw.createRegularPolygon(4);
break;
case "Box":
type = 'Circle';
// 生成盒形状的图形函数
geometryFunction = ol.interaction.Draw.createBox();
break;
default:
break;
// 初始化Draw绘图控件
draw = new ol.interaction.Draw({
source: vectorSource,
type: type,
geometryFunction: geometryFunction
// 将Draw绘图控件加入Map对象
map.addInteraction(draw);
typeSelect.addEventListener('change', () => {
// 移除Draw绘图控件
map.removeInteraction(draw);
addInteraction();
addInteraction();
</script>
</body>效果:

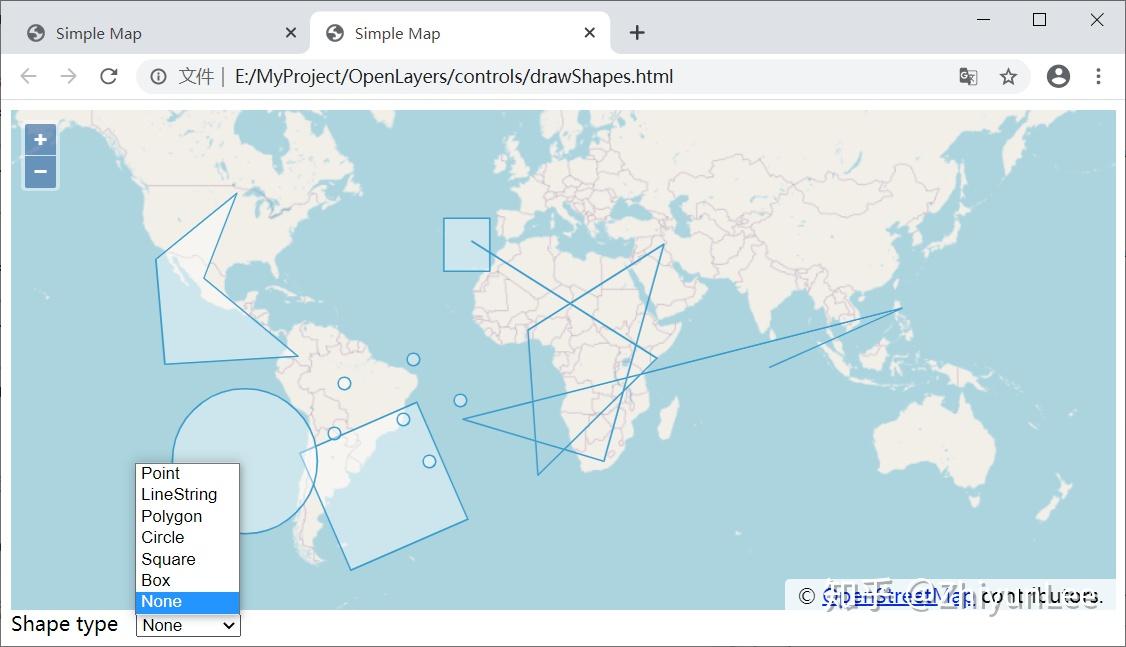
Shift + 鼠标左键:手绘(free hand)模式
鼠标拖拽:图形编辑
Alt + 鼠标左键:删除节点
修改绘图样式:
<script>
	let vectorLayer = new ol.layer.Vector({
        source: vectorSource,
        // 修改绘制图层样式
        style: new ol.style.Style({
            // 修改填充样式
            fill: new ol.style.Fill({
                color: 'rgba(255, 255, 255, 0.2)',
            // 修改线条样式
            stroke: new ol.style.Stroke({
                color: '#ffcc33',
                width: 2,
            // 修改圆点样式
            image: new ol.style.Circle({
                radius: 7,
                fill: new ol.style.Fill({
                    color: '#ffcc33',
</script>
添加可编辑功能:
<script>
	let map = new ol.Map({
        target: 'map',
        layers: [
            new ol.layer.Tile({
                source: new ol.source.OSM()
            vectorLayer
        view: new ol.View({
            projection: 'EPSG:3857',
            center: [0, 0],
            zoom: 0
    // 创建Modify控件
    let modify = new ol.interaction.Modify({source: vectorSource});
    // 将控件添加至Map对象中
    map.addInteraction(modify);
</script>
添加捕捉功能:
<script>
function addInteraction() {
    let type = typeSelect.value;
    if (type !== 'None') {
        let geometryFunction;
        switch(type) {
            case "Square":
                type = 'Circle';
                geometryFunction = ol.interaction.Draw.createRegularPolygon(4);
                break;
            case "Box":
                type = 'Circle';
                geometryFunction = ol.interaction.Draw.createBox();
                break;
            default:
                break;
        draw = new ol.interaction.Draw({
            source: vectorSource,
            type: type,
            geometryFunction: geometryFunction
        map.addInteraction(draw);
        // 创建Snap控件
        snap = new ol.interaction.Snap({source: vectorSource});
        // 将控件添加至Map对象中
        map.addInteraction(snap);
</script>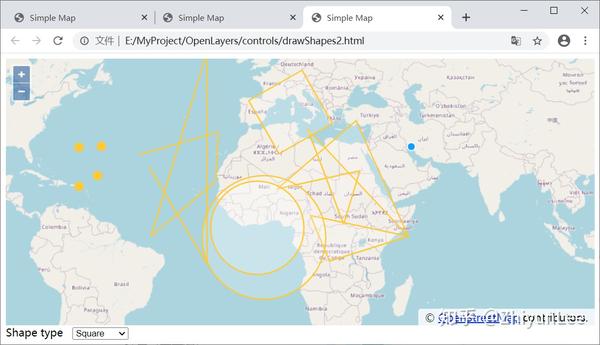

这个示例展示了初始化ol.interaction.Draw对象时设置的三个参数:
- source:绘制的几何图形将会被存储到这个地图源中
- type:要绘制的几何图形的类型
- geometryFunction:这个参数可以比较自由地设置要绘制的几何图形的形状
注意:使用createBox()和createRegularPolygon()这两个函数来生成图形时,type参数必须要设置为'Circle'。

五、数据对接
1、WKT
WKT(Well-known Text)可以通过文本来描述几何对象。主要类型有:
| 几何类型 | WKT 例子 | 说明 |
| Point | Point (10 10) | 点 |
| LineString | LineString ( 10 10, 20 20, 30 40) | 有3个节点的线 |
| Polygon | Polygon ((10 10, 10 20, 20 20, 20 15, 10 10)) | 只有1个外环的多边形 |
| MultiPoint | MultiPoint((10 10),(20 20)) | 多点 |
| MultiLineString | MultiLineString((10 10, 20 20),(15 15, 30 15)) | 多线 |
| MultiPolygon | MultiPolygon(((10 10, 10 20, 20 20, 20 15, 10 10)),((60 60, 70 70, 80 60, 60 60 ))) | 多面 |
| GeometryCollection |
GeometryCollection
(POINT (10 10),POINT (30 30),LINESTRING (15 15, 20 20)) |
几何集合 |
| PolyhedralSurface |
PolyhedralSurface Z(
((0 0 0, 0 0 1, 0 1 1, 0 1 0, 0 0 0)),((0 0 0, 0 1 0, 1 1 0, 1 0 0, 0 0 0)),((0 0 0, 1 0 0, 1 0 1, 0 0 1, 0 0 0)),((1 1 0, 1 1 1, 1 0 1, 1 0 0, 1 1 0)),((0 1 0, 0 1 1, 1 1 1, 1 1 0, 0 1 0)),((0 0 1, 1 0 1, 1 1 1, 0 1 1. 0 0 1))) |
多个表面构成的立方体 |
| Tin |
Tin Z(
((0 0 0, 0 0 1, 0 1 0, 0 0 0)),((0 0 0, 0 1 0, 1 0 0, 0 0 0)),((0 0 0, 1 0 0, 0 0 1, 0 0 0)),((1 0 0, 0 1 0, 0 0 1, 1 0 0)),) |
4个三角形构成的TIN网格 |
| Point | Point Z (10 10 5) | 三维点 |
| Point | Point ZM (10 10 5 40) | 带M值的三维点 |
| Point | Point M (10 10 40) | 带M值的二维点 |
JavaScript获取方法:
// 图形绘制结束触发
draw.on('drawend', function (e) {
    // 绘制对象加入数组
    let feature = e.feature;
    featureDate.push(feature);
    // WKT数据加入数组
    let wkt = getWKTData(geometryType, feature);
    WKTData.push(wkt);
// 获取图形WKT数据
function getWKTData(geometryType, feature) {
    if (geometryType === 'Circle') {
        // 表示圆形
        let geometry = feature.values_.geometry;
        let polygon = ol.geom.Polygon.fromCircle(geometry, 128, 90);
        feature.setGeometry(polygon);
    return new ol.format.WKT().writeFeature(feature);
2、GeoJSON
GeoJSON总是由一个单独的对象组成。这个对象(指的是下面的GeoJSON对象)表示几何、特征或者特征集合。
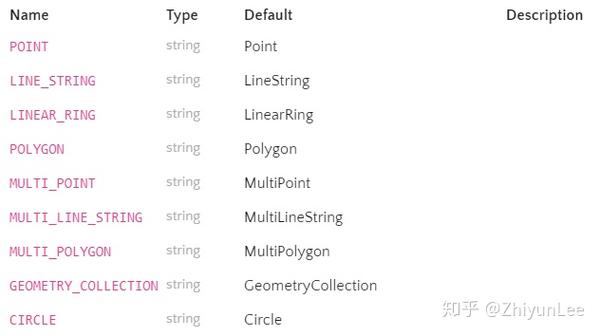
GeoJSON对象必须由一个名字为”type”的成员。这个成员的值是由GeoJSON对象的类型所确定的字符串。 type成员的值必须是下面之一: * “Point”, “MultiPoint”, “LineString”, “MultiLineString”, “Polygon”, “MultiPolygon”, “GeometryCollection”, “Feature”, 或者 “FeatureCollection”。这儿type成员值必须如这儿所示。
// 图形绘制结束触发
draw.on('drawend', function (e) {
    // 绘制对象加入数组
    let feature = e.feature;
    featureDate.push(feature);
    // GeoJSON数据加入数组
    let geoJSON = getGepJSONData(geometryType, feature);
    geoJSONData.push(wkt);
// 获取图形GeoJSON数据
function getGeoJSONData(geometryType, feature) {
    if (geometryType === 'Circle') {
        // 表示圆形
        let geometry = feature.values_.geometry;
        let polygon = ol.geom.Polygon.fromCircle(geometry, 128, 90);
        feature.setGeometry(polygon);
    return new ol.format.GeoJSON().writeFeature(feature);
// 写入图形GeoJSON数据
function readGeoJSONData(objectData) {
    objectData.forEach(function (item) {