

Python期货量化交易基础教程(20)

20、技术指标绘图
我们在第16章用浏览器实现过绘制技术指标,但当技术指标数量多时浏览器容易卡顿,所以我们需要一种更高性能的绘图方法。
Python绘图库最著名的莫属matplotlib,matplotlib强大、专业,适用于各种数据分析领域,但在实时绘制K线图时性能有些低,尤其是数据量大的时候更显不足,我们推荐使用PyQtGraph,PyQtGraph提供了高度优化的绘图接口。
本章借鉴了开源量化平台VNPY绘制K线的方法。
PyQtGraph依赖于PyQt,可与PyQt配合使用,PyQtGraph可嵌入PyQt的部件组成丰富的GUI界面程序。
安装pyqtgraph:
pip install pyqtgraph -i https://pypi.tuna.tsinghua.edu.cn20.1、PyQtGraph简介:
PyQtGraph应用基于项的图形概念,例如,窗口中的一个图片就是一个项,图片上的一个曲线或一个文字也是一个项,窗口由GraphicsView或其子类创建,图形项由QGraphicsItem或其子类创建,窗口包括窗口中的各种图形项组成一个图形视图。
图形视图需要创建一个场景(scene),类似舞台表演之前需要建立一个环境用来搭建舞台,这个场景是通过QGraphicsScene对象实现的,通常会自动创建。
场景用来管理图形项,对场景中的一个项变换,也会应用到其子对象,例如移动一个图片,图片上的各类图形会跟着移动。
图形视图使用三种坐标系,最顶层的窗口使用物理坐标系,类似画图时的画框,物理坐标系左上角坐标原点(0,0),场景使用逻辑坐标系,类似画框上的画图区,第三种坐标系是图形项使用的坐标系,它是以(0,0)为原点的逻辑坐标系,每个项的原点就是该项在场景中的位置。
图形项也称为图元Item,图元Item通过创建QGraphicsItem的子类来创建,在子类中需要实现它的两个纯虚拟公共函数: boundingRect() ,它返回图元绘制的区域的估计值,即图元在这个函数返回的范围内绘制; paint() ,它实现实际的绘画,绘制基于逻辑坐标系,默认原点是(0,0)。这两个函数会被自动调用。
图形视图的层次结构如下:
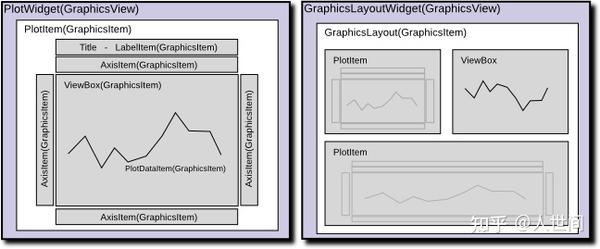

图元Item有以下三种:
数据类(QGraphicsItem的子类)
- PlotCurveItem - 显示给定x,y数据的绘图线
- ScatterPlotItem - 显示给定x,y数据的点
- PlotDataItem - 组合PlotCurveItem和ScatterPlotItem。
容器类(QGraphicsItem的子类;包含其他QGraphicsItem对象,必须在GraphicsView中查看)
- PlotItem - 包含用于显示数据的ViewBox以及用于显示轴和标题的AxisItems和标签。这是一个QGraphicsItem子类,因此只能在GraphicsView中使用。
- GraphicsLayout - QGraphicsItem子类,显示项目网格。这用于一起显示多个PlotItem。
- ViewBox - 用于显示数据的QGraphicsItem子类。用户可以使用鼠标缩放/平移ViewBox的内容。通常,所有PlotData / PlotCurve / ScatterPlotItem都在ViewBox中显示。
- AxisItem- 显示轴值,刻度和标签。最常用于PlotItem。
容器类(QWidget的子类;可以嵌入在PyQt GUI中)
- PlotWidget - GraphicsView的子类,显示单个PlotItem。PlotItem提供的大多数方法也可以通过PlotWidget获得。可用QWidget的方法。
- GraphicsLayoutWidget - QWidget子类,显示单个GraphicsLayout。GraphicsLayout提供的大多数方法也可以通过GraphicsLayoutWidget获得。
在PyQtGraph中,有以下几种绘制数据类图形的方法:
- pyqtgraph.plot():创建一个新的绘图窗口来显示数据,该函数返回一个PlotWindow的实例。
- PlotWidget.plot():将一组新的数据添加到现有的绘图小部件。
- PlotItem.plot():将一组新的数据添加到现有的绘图小部件。
- GraphicsLayout.addPlot():添加一个新的图形到一个网格中。
plot()方法的基本参数如下:
- x - X轴数据(可选)。如果没有赋值的话,程序则自动生成特定范围的整数值
- y - Y轴数据
- pen - 图表线条的画笔参数,若设为None则不显示线条
- symbol - 参数为字符串类型,用于描述图表每个坐标点的形状。比如设为'o',则坐标点的形状就为o。可选值总共有这么几种:'o', 's', 't', 't1', 't2', 't3','d', '+', 'x', 'p', 'h', 'star'
- symbolPen - 描绘符号轮廓的画笔参数
- symbolBrush - 填充符号的画刷参数
- fillLevel - 用于计算曲线下面积的Y坐标值
- brush - 用于填充曲线下面积的画刷
PyQtGraph提供了两种类似的方法来进行全局设置:
pyqtgraph.setConfigOptions(**opts) # 同时设置多项参数
pyqtgraph.getConfigOption(opt)     # 只设置一项参数
我们可以这么使用:
# 禁止拖动图表,并启用抗锯齿
pyqtgraph.setConfigOptions(leftButtonPan=False, antialias=True)
# 禁止拖动图表
pyqtgraph.getConfigOption('leftButtonPan', True)
#设置背景
pyqtgraph.setConfigOption('background', 'w')
pyqtgraph.setConfigOption('foreground', 'k')
背景颜色为pyqtgraph.mkColor函数的合法输入,包括以下形式:
- 以下字符中的一个: r, g, b, c, m, y, k, w
- R, G, B, [A] integers 0-255
- (R, G, B, [A]) tuple of integers 0-255
- float greyscale, 0.0-1.0
- int see :func:intColor() <pyqtgraph.intColor>
- (int, hues) see :func:intColor() <pyqtgraph.intColor>
- “RGB” hexadecimal strings; may begin with ‘#’
- “RGBA”
- “RRGGBB”
- “RRGGBBAA”
- QColor QColor instance; makes a copy.
20.2、技术指标绘制:
20.2.1、K线和成交量绘制类:
首先需要记录K线,函数get_kline_serial()订阅K线后K线的数量便固定了,K线更新时只是修改原数据,不会增加数量,因此若想记录K线的增加可使用如下类:
#K线记录
代码省略
初始化BarManager时传入订阅的K线,然后随着K线更新反复调用update_bar()即可把新K线追加到变量self.bars中。
若要画价差K线,也可以模仿K线记录类编写价差K线的记录类,例如:
#价差K线
代码省略
价差K线需传入两个K线,然后对应开盘价和收盘价做差,最低和最高价由于时间不一定同步做差会不准确,需用tick级别对齐时间,但会复杂很多就不做处理了,用这个粗略价差K线也是可以参考的。
由于不同指标和K线需要对齐x轴,以免图形发生错位,简单的处理方法是重置K线数据的行索引,用K线的总数量重置行索引,绘图时x轴会按行索引对齐。
K线包含影线和实体,影线是线段,实体是矩形,成交量以柱体显示也是矩形,我们用QPainter类来画K线和成交量,QPainter需要在一个绘图设备上画图,绘图设备包含QPixmap、QImage、QBitmap、QPicture,我们用的绘图设备是QPicture,QPicture用来记录QPainter的绘制指令,在paint()中重放QPicture记录的绘制指令即可画图。
例如,用以下函数绘制K线:
def _draw_bar_picture(self, ix: int,bar) -> QtGui.QPicture:
        candle_picture = QtGui.QPicture() #创建QPicture
        painter = QtGui.QPainter(candle_picture) #QPicture开始记录QPainter的绘制指令
        if bar.close > bar.open:
            painter.setPen(pg.mkPen('r')) #设置画笔颜色,r为红色
            painter.setBrush(pg.mkBrush('r')) #设置笔刷颜色
        elif bar.close < bar.open:
            painter.setPen(pg.mkPen('g'))
            painter.setBrush(pg.mkBrush('g'))
        else :
            painter.setPen(pg.mkPen('b'))
            painter.setBrush(pg.mkBrush('b'))
        if bar.low == bar.high : #画影线
            painter.drawLine(QtCore.QPointF(ix- BAR_WIDTH, bar.low), QtCore.QPointF(ix+BAR_WIDTH, bar.high))
        else:
            painter.drawLine(QtCore.QPointF(ix, bar.low), QtCore.QPointF(ix, bar.high))
        painter.drawRect(QtCore.QRectF(ix - BAR_WIDTH, bar.open, BAR_WIDTH*2, bar.close-bar.open)) #画实体
        # Finish
        painter.end()  #画图指令记录结束
        return candle_picture #绘制结束,返回记录了绘制命令的candle_picture以在paint函数中回放
参数ix是需要绘制K线的x轴位置,bar是一根K线,首先创建QPicture,然后创建QPainter并传入参数QPicture,QPicture便开始记录QPainter的指令,QPainter.end()结束记录,然后返回QPicture,QPicture会在 paint()函数 中重放画图指令,例如:
def paint(self, painter: QtGui.QPainter,opt: QtWidgets.QStyleOptionGraphicsItem,w: QtWidgets.QWidget): #自动重画
        candle_picture.play(painter) #重放指令,开始绘图
boundingRect()函数 用来设置绘图的范围,例如:
def boundingRect(self) -> QtCore.QRectF: #返回该图元所绘制的区域
        min_price, max_price = self._barmanager.bars.low.min(),self._barmanager.bars.high.max()
        #逻辑坐标,x轴原点0,y轴k线最低价,宽度为全部K线图,高度为最高价与最低价的差
        rect = QtCore.QRectF(0,min_price,len(self._bar_picutures),max_price - min_price)
        return rect
随着K线更新,K线的价格范围也会变化,以下函数被反复调用以返回指定x轴范围的y轴价格范围:
def get_y_range(self, min_ix: int = None, max_ix: int = None) -> Tuple[float, float]:
        min_price, max_price = self._barmanager.bars.loc[min_ix:max_ix].low.min(),self._barmanager.bars.loc[min_ix:max_ix].high.max()
        return min_price, max_price
成交量的绘制过程和K线类似,可把K线和成交量的公共函数写在同一个类中,K线和成交量作为子类继承该类即可,例如:
完整的代码如下:
class ChartItem(pg.GraphicsObject): # K线和成交量的公共类
    def __init__(self, barmanager: BarManager):
        super().__init__()
        self._barmanager: BarManager = barmanager #K线管理类
        self._bar_picutures: Dict[int, QtGui.QPicture] = {} #键是x轴位置,值是每一根K线的绘制指令
        self._item_picuture: QtGui.QPicture = None #用来记录重放绘制的命令
        # 只重画部分图形,大大提高界面更新速度
        self.setFlag(self.ItemUsesExtendedStyleOption)
    @abstractmethod
    def _draw_bar_picture(self, ix: int, bar) -> QtGui.QPicture:
        #公共函数,由子类重写
    @abstractmethod
    def boundingRect(self) -> QtCore.QRectF:
    @abstractmethod
    def get_y_range(self, min_ix: int = None, max_ix: int = None) -> Tuple[float, float]:
    #先调用,用来画历史K线
    def update_history(self) :
        self._bar_picutures.clear() #清空历史绘图再重绘
        for k in self._barmanager.bars.itertuples(): #为每一根历史k线绘图
            bar_picture = self._draw_bar_picture(k.Index,k)
            self._bar_picutures[k.Index] = bar_picture
        self.update() #刷新场景以更新图元
    def update_bar(self) : #画新k,反复调用以创建每一根k的picture
        记录每根k的绘图指令到self._bar_picutures
        klines = self._barmanager.bars
        bar_picture = self._draw_bar_picture(len(klines)-1,klines.iloc[-1]) #写入画图指令,始终重画最新一根k
        self._bar_picutures[len(klines)-1] = bar_picture #把记录了画k指令的picture更新到字典
        self.update()
    def update(self) -> None: #刷新场景以更新图元
        if self.scene(): #返回QGraphicsItem的场景,在QGraphicsItem尚未添加场景时返回none
            self.scene().update() #在可见的场景视图中安排一个QGraphicItem绘图事件
    #重放picuture中的指令绘图
    def paint(self, painter: QtGui.QPainter,opt: QtWidgets.QStyleOptionGraphicsItem,w: QtWidgets.QWidget): #自动重画
        监听绘图指令
        rect = opt.exposedRect #返回图元区域
        min_ix = int(rect.left())
        max_ix = int(rect.right())
        max_ix = min(max_ix, len(self._bar_picutures)) #重置x轴最大值
        self._draw_item_picture(min_ix, max_ix)  #用_item_picuture记录重放绘制的过程
        self._item_picuture.play(painter) #开始绘图
    def _draw_item_picture(self, min_ix: int, max_ix: int) -> None:
        在特定范围内画图
        self._item_picuture = QtGui.QPicture() #新绘图
        painter = QtGui.QPainter(self._item_picuture)
        for n in range(min_ix, max_ix): #遍历绘图x轴,重放视图范围内的指令
            bar_picture = self._bar_picutures[n] #按x轴位置获取绘图
            bar_picture.play(painter) #重放绘图位置n中的painter指令
        painter.end() #记录结束 上述重放过程由self._item_picuture记录
class CandleItem(ChartItem): #K线类
    def __init__(self, barmanager: BarManager):
        super().__init__(barmanager) #使用父类ChartItem的初始化
    #绘制K线
    def _draw_bar_picture(self, ix: int,bar) -> QtGui.QPicture:
        candle_picture = QtGui.QPicture() #创建QPicture
        painter = QtGui.QPainter(candle_picture) #QPicture开始记录QPainter的绘制指令
        if bar.close > bar.open:
            painter.setPen(pg.mkPen('r'))
            painter.setBrush(pg.mkBrush('r'))
        elif bar.close < bar.open:
            painter.setPen(pg.mkPen('g'))
            painter.setBrush(pg.mkBrush('g'))
        else :
            painter.setPen(pg.mkPen('b'))
            painter.setBrush(pg.mkBrush('b'))
        if bar.low == bar.high : #画影线
            painter.drawLine(QtCore.QPointF(ix- BAR_WIDTH, bar.low), QtCore.QPointF(ix+BAR_WIDTH, bar.high))
        else:
            painter.drawLine(QtCore.QPointF(ix, bar.low), QtCore.QPointF(ix, bar.high))
        painter.drawRect(QtCore.QRectF(ix - 0.3, bar.open, 0.3*2, bar.close-bar.open)) #画实体
        painter.end()
        return candle_picture #绘制结束,返回记录了绘制命令的candle_picture以在paint函数中回放
    def boundingRect(self) -> QtCore.QRectF: #返回该图元所绘制的区域
        min_price, max_price = self._barmanager.bars.low.min(),self._barmanager.bars.high.max()
        #逻辑坐标,x轴原点0,y轴k线最低价,宽度为全部K线图,高度为最高价与最低价的差
        rect = QtCore.QRectF(0,min_price,len(self._bar_picutures),max_price - min_price)
        return rect
    def get_y_range(self, min_ix: int = None, max_ix: int = None) -> Tuple[float, float]:
        min_price, max_price = self._barmanager.bars.loc[min_ix:max_ix].low.min(),self._barmanager.bars.loc[min_ix:max_ix].high.max()
        return min_price, max_price
class VolumeItem(ChartItem): #成交量类
    def __init__(self, barmanager: BarManager):
        super().__init__(barmanager)
    def _draw_bar_picture(self, ix: int,bar) -> QtGui.QPicture:
        volume_picture = QtGui.QPicture()
        painter = QtGui.QPainter(volume_picture)
        if bar.close > bar.open:
            painter.setPen(pg.mkPen('r'))
            painter.setBrush(pg.mkBrush('r'))
        elif bar.close < bar.open:
            painter.setPen(pg.mkPen('g'))
            painter.setBrush(pg.mkBrush('g'))
        else :
            painter.setPen(pg.mkPen('b'))
            painter.setBrush(pg.mkBrush('b'))
        painter.drawRect(QtCore.QRectF(ix - 0.3, 0, 0.3*2, bar.volume))
        painter.end()
        return volume_picture
    def boundingRect(self) -> QtCore.QRectF:
        min_volume, max_volume = self._barmanager.bars.volume.min(),self._barmanager.bars.volume.max()
        rect=QtCore.QRectF(0,min_volume,len(self._bar_picutures),max_volume - min_volume)
        return rect
    def get_y_range(self, min_ix: int = None, max_ix: int = None) -> Tuple[float, float]:
        min_volume, max_volume = self._barmanager.bars.loc[min_ix:max_ix].volume.min(),self._barmanager.bars.loc[min_ix:max_ix].volume.max()
        return min_volume, max_volume
实际使用中成交量的作用不大,用其他软件看成交量即可,没必要重画。
20.2.2、技术指标计算类:
类似均线这样的曲线,我们可创建一个曲线类,用该曲线类统一计算这类曲线,例如:
class CurveItem(): #曲线类
    代码省略
技术指标计算函数采用的是模块tqsdk.ta中的函数,模块tqsdk.ta中的函数默认用K线的收盘价计算,返回值为pandas.DataFrame类型,一开始指标周期范围内的K线不够计算的,指标值会以Nan值表示,但Nan值是不确定值,无法绘图,需要对Nan值替换,一个方法是替换成第一个计算出的指标值,即绘图时把最开始的指标画成直线。
函数update_bar会被反复调用以更新指标值,由于技术指标需要与K线的x轴对齐,因此默认以全部K线计算,但当K线数量逐渐增多时会增加计算量,如果只计算最新的K线效率会更高,但对齐x轴又需要增加更多代码量,读者可自行尝试。
MACD指标既有曲线又有直线,可以分别来画,曲线用曲线类CurveItem计算,直线可类似画K线影线那样画,则需要多创建一个画MACD柱线的类,如下:
class MACDItem(pg.GraphicsObject):
    代码省略
20.2.3、x轴时间显示:
x轴默认显示K线序号,可显示为日期时间,通过轴AxisItem修改,例如:
class DatetimeAxis(pg.AxisItem):
    def __init__(self, barmanager: BarManager, *args, **kwargs):
        super().__init__(*args, **kwargs)
        self._barmanager: BarManager = barmanager #传入k线管理实例
        self.setPen(width=0.8) #画笔宽度
        self.tickFont = QtGui.QFont("Arial", 9) #刻度字体
    def tickStrings(self, values: List[int], scale: float, spacing: int):
        参数values自动传入x坐标
        # 行索引和时间组合字典,行索引和x轴对应
        datetime_index_map = dict(zip(self._barmanager.bars.index, self._barmanager.bars.datetime))
        strings = []
        for ix in values:
            dt = datetime_index_map.get(ix, None) #x轴对应的时间
            if not dt:s = ""
            else:
                dt = datetime.fromtimestamp(dt/1e9) #转换成datetime格式
                if dt.hour: #日内周期
                    s = dt.strftime("%Y-%m-%d\n%H:%M:%S")
                else:
                    s = dt.strftime("%Y-%m-%d")
            strings.append(s)
        return strings
函数tickStrings会被自动调用以转换x轴刻度。
20.2.4、指标窗口类:
我们用PlotWidget创建一个指标窗口,用GraphicsLayout创建一个图形层,图形层可以以网格的形式布局图元,我们把图形层设置为PlotWidget的中心层,例如:
class ChartWidget(pg.PlotWidget): #继承于绘图物件
    def __init__(self, parent: QtWidgets.QWidget = None):
        super().__init__(parent)
        self._manager: Dict[str, BarManager] = {} #K线记录类和K线名组成字典
        self._init_ui()
    def _init_ui(self) -> None:
        self.setWindowTitle("技术图表")  #设置窗口标题
        self._layout = pg.GraphicsLayout() #创建一个图形层,用来布局窗口
        self._layout.setContentsMargins(10, 10, 10, 10) #左、上、右、下的外边距,图形层与窗口边缘的距离
        self._layout.setSpacing(0) #设置图层内图元间距,多个图元间距为0
        self._layout.setBorder(color=(100, 100, 100), width=0.8) #设置图层边框灰色,粗度0.8
        #设置item的层叠顺序的。zValue值大的item在zValue值小的item之上。如果不设置默认为为0,item的层叠会按照加入的顺序层叠。k线在同一个平面
        self._layout.setZValue(0)
        self.setCentralItem(self._layout) #将图形层设置为视图窗口的中心层
我们在图形层GraphicsLayout中添加图元容器PlotItem,可按行列位置添加,在图元容器PlotItem中再添加K线或指标图形,还可以添加文字,例如:
plot = pg.PlotItem() #创建图元容器
#把图元容器添加到图形层的第一行第一列,占据2行2列
self._layout.addItem(plot,row=1,col=1,rowspan=2,colspan=2)
item = ChartItem() #创建K线类
plot.addItem(item) #把K线添加到图元容器
indicator=pg.PlotCurveItem() #创建曲线图元
plot.addItem(indicator)  #把曲线图元添加到图元容器
label = pg.TextItem()
plot.addItem(label)  #把文字标签添加到图元容器
反复调用K线类的update_bar函数即可绘制K线,曲线类需要用setData()函数更新指标值。
总结一下绘图流程:
- 创建指标窗口PlotWidget,创建图形层GraphicsLayout,将图形层设置为窗口的中心层。
- 创建图元容器PlotItem,将PlotItem添加到图形层。
- 创建K线或曲线类,将K线或曲线类添加到图元容器PlotItem。
- 调用K线类的绘图函数画K线,曲线类调用setData()函数更新指标值。
上述是简化过程,还有一些细节工作要做,比如调用K线管理类更新K线,图元容器是否显示x轴或其他轴,图元容器x轴是否联动,比如成交量指标处在副图的图元容器,和主图K线所处的图元容器x轴应该联动,这样拖动一个图形,另一个就可以跟着移动,主图的图元称为锚定图元,其他副图图元可锚定该图元的x轴以实现联动,随着K线的更新,图元容器需调整可视范围以始终显示最新K线,不同的图元容器是否显示不同的K线,等等。
我们结合窗口类的完整代码看一下:
from typing import List, Dict, Type, Tuple
from abc import abstractmethod
import pandas
from datetime import datetime
import pyqtgraph as pg
from PyQt5 import QtGui, QtWidgets, QtCore
class ChartWidget(pg.PlotWidget): #继承于绘图物件
    MIN_BAR_COUNT = 100 #最少K线数量
    def __init__(self, parent: QtWidgets.QWidget = None):
        super().__init__(parent)
        self._manager: Dict[str, BarManager] = {} #K线记录类和K线名组成字典
        self._plots: Dict[str, pg.PlotItem] = {} #图元容器名和图元容器字典,对画不同指标的图元按名分类
        self._items: Dict[str, ChartItem] = {}  #图元容器名和容器内的图形(GraphicsObject),对不同的指标图形按名分类
        self._item_plot_map: Dict[ChartItem, pg.PlotItem] = {} #图形和图元容器字典
        self._xlinkplot_kline_map: Dict[pg.PlotItem,str] = {} #K线和锚定图元,多个锚定图元可基于同一k线
        self._item_kline_map: Dict[ChartItem,str] = {} #K线和图形
        self._xlink_plot: Dict[str, pg.PlotItem] = {} #锚定图元名及锚定图元
        self._plot_xlinkplot: Dict[pg.PlotItem, pg.PlotItem] = {} #图元与锚定图元,有着共同的x值
        self._right_ix: Dict[str, int] = {}         # k线最右端id ,在绘制事件发生后更新,与锚定图元对应的k线
        self._bar_count: int = self.MIN_BAR_COUNT   # 图表可见k线数量
        self._init_ui()
    def _init_ui(self) -> None:
        self.setWindowTitle("技术图表")  #设置窗口标题
        self._layout = pg.GraphicsLayout() #创建一个图形层,用来布局窗口
        self._layout.setContentsMargins(10, 10, 10, 10) #左、上、右、下的外边距,图形层与窗口边缘的距离
        self._layout.setSpacing(0) #设置图层内图元间距,多个图元间距为0
        self._layout.setBorder(color=(100, 100, 100), width=0.8) #设置图层边框灰色,粗度0.8
        #设置item的层叠顺序的。zValue值大的item在zValue值小的item之上。如果不设置默认为为0,item的层叠会按照加入的顺序层叠。k线在同一个平面
        self._layout.setZValue(0)
        self.setCentralItem(self._layout) #将图形层设置为视图窗口的中心层
    以下代码省略
20.2.5、图形显示:
我们把上述几个类的代码保存在文件中,例如文件名:klineschart.py,文件作为模块导入到代码中,我们还需要用到第19章里的信号线程,我们结合代码看一下:
import sys
from tqsdk import TqApi, TqAuth, TqAccount
from tqsdk import ta, tafunc
import pyqtgraph as pg
from PyQt5.QtCore import Qt,pyqtSignal,QThread
from PyQt5.QtWidgets import *
from tqsdk.demo.klineschart import ChartWidget,CandleItem,VolumeItem,MACDItem,CurveItem
class GengXinShuJu(QThread):
    my_signal = pyqtSignal()
    def __init__(self):
        super().__init__()
    def run(self):#更新发送信号
        while True:
            api.wait_update()
            self.my_signal.emit()
#更新指标曲线的函数
def updateindicator():
def draw_textfirst():
if __name__ == '__main__':
    app = QApplication(sys.argv) #创建程序入口
    api = TqApi(TqAccount('H期货公司', '期货账号', '密码'),auth=TqAuth("信易账号", "密码"))
    klines1 = api.get_kline_serial('SHFE.rb2105',3600,200)
    klines2 = api.get_kline_serial('SHFE.rb2109',3600,200)
    widget = ChartWidget() #实例化
    widget.resize(1000, 800)
    widget.add_klines(['klines1','klines2'],[klines1,klines2]) #K线添加到记录类
    widget.add_diffklines('rb2105-rb2109',klines1,klines2) #记录价差K线
    widget.add_plot("candle1",'klines1',XLink_plot="candle1")  #添加图元容器
    widget.add_plot("volume",'klines1', maximum_height=200,hide_axis=[],show_x_time=True,XLink_plot='candle1',row=1,col=0) #添加成交量
    widget.add_plot("candle2",'klines2',XLink_plot="candle2",row=2,col=0)
    widget.add_plot("macd",'klines2', maximum_height=200,hide_axis=[],show_x_time=True,XLink_plot='candle2',row=3,col=0) #添加成交量
    widget.add_plot("candle3",'rb2105-rb2109',XLink_plot="candle3",show_axis=['right','bottom'],show_x_time=True,row=4,col=0)  #添加K线
    widget.add_item(CandleItem, "candle1", "candle1",'klines1') #画K线图元添加到图元容器candle
    widget.add_item(CandleItem, "candle2", "candle2",'klines2') #画K线图元添加到图元容器candle2
    widget.add_item(VolumeItem, "volume1", "volume",'klines2') #添加成交量图元
    widget.add_indicatoritem(MACDItem,'macd1','macd','klines2','macd',ta.MACD,period=[12,26,9]) #添加MACD柱线图元
    widget.add_item(CandleItem, "candle3", "candle3",'rb2105-rb2109') #画价差K线类
    curve1 = CurveItem(widget._manager['klines1'],ta.EMA,10) #计算3条均线
    curve2 = CurveItem(widget._manager['klines1'],ta.EMA,20)
    curve3 = CurveItem(widget._manager['klines1'],ta.EMA,60)
    indicator1=pg.PlotCurveItem() #创建曲线图元
    widget._plots['candle1'].addItem(indicator1) #曲线1添加到图元容器candle
    indicator1.setPen(pg.mkPen(color='r', width=1)) #设置曲线的颜色和宽度
    indicator2=pg.PlotCurveItem()
    widget._plots['candle1'].addItem(indicator2)
    indicator2.setPen(pg.mkPen(color='b', width=2))
    indicator3=pg.PlotCurveItem()
    widget._plots['candle1'].addItem(indicator3)
    indicator3.setPen(pg.mkPen(color='g', width=3))
    curve40 = CurveItem(widget._manager['klines2'],ta.BOLL,26,2) #计算布林线
    indicator41=pg.PlotCurveItem()
    widget._plots['candle2'].addItem(indicator41)
    indicator41.setPen(pg.mkPen(color='r', width=1))
    indicator42=pg.PlotCurveItem()
    widget._plots['candle2'].addItem(indicator42)
    indicator42.setPen(pg.mkPen(color='b', width=1))
    indicator43=pg.PlotCurveItem()
    widget._plots['candle2'].addItem(indicator43)
    indicator43.setPen(pg.mkPen(color='b', width=1))
    curve50 = CurveItem(widget._manager['klines2'],ta.MACD,12,26,9) #计算MACD指标
    indicator51=pg.PlotCurveItem()
    widget._plots['macd'].addItem(indicator51)
    indicator51.setPen(pg.mkPen(color='w', width=1))
    indicator52=pg.PlotCurveItem()
    widget._plots['macd'].addItem(indicator52)
    indicator52.setPen(pg.mkPen(color='y', width=1))
    widget.update_history() #先画初始K线
    updateindicator() #画初始指标
    draw_textfirst() #画初始文字
    GengXin_ShuJu=GengXinShuJu() #信号线程,发送数据更新