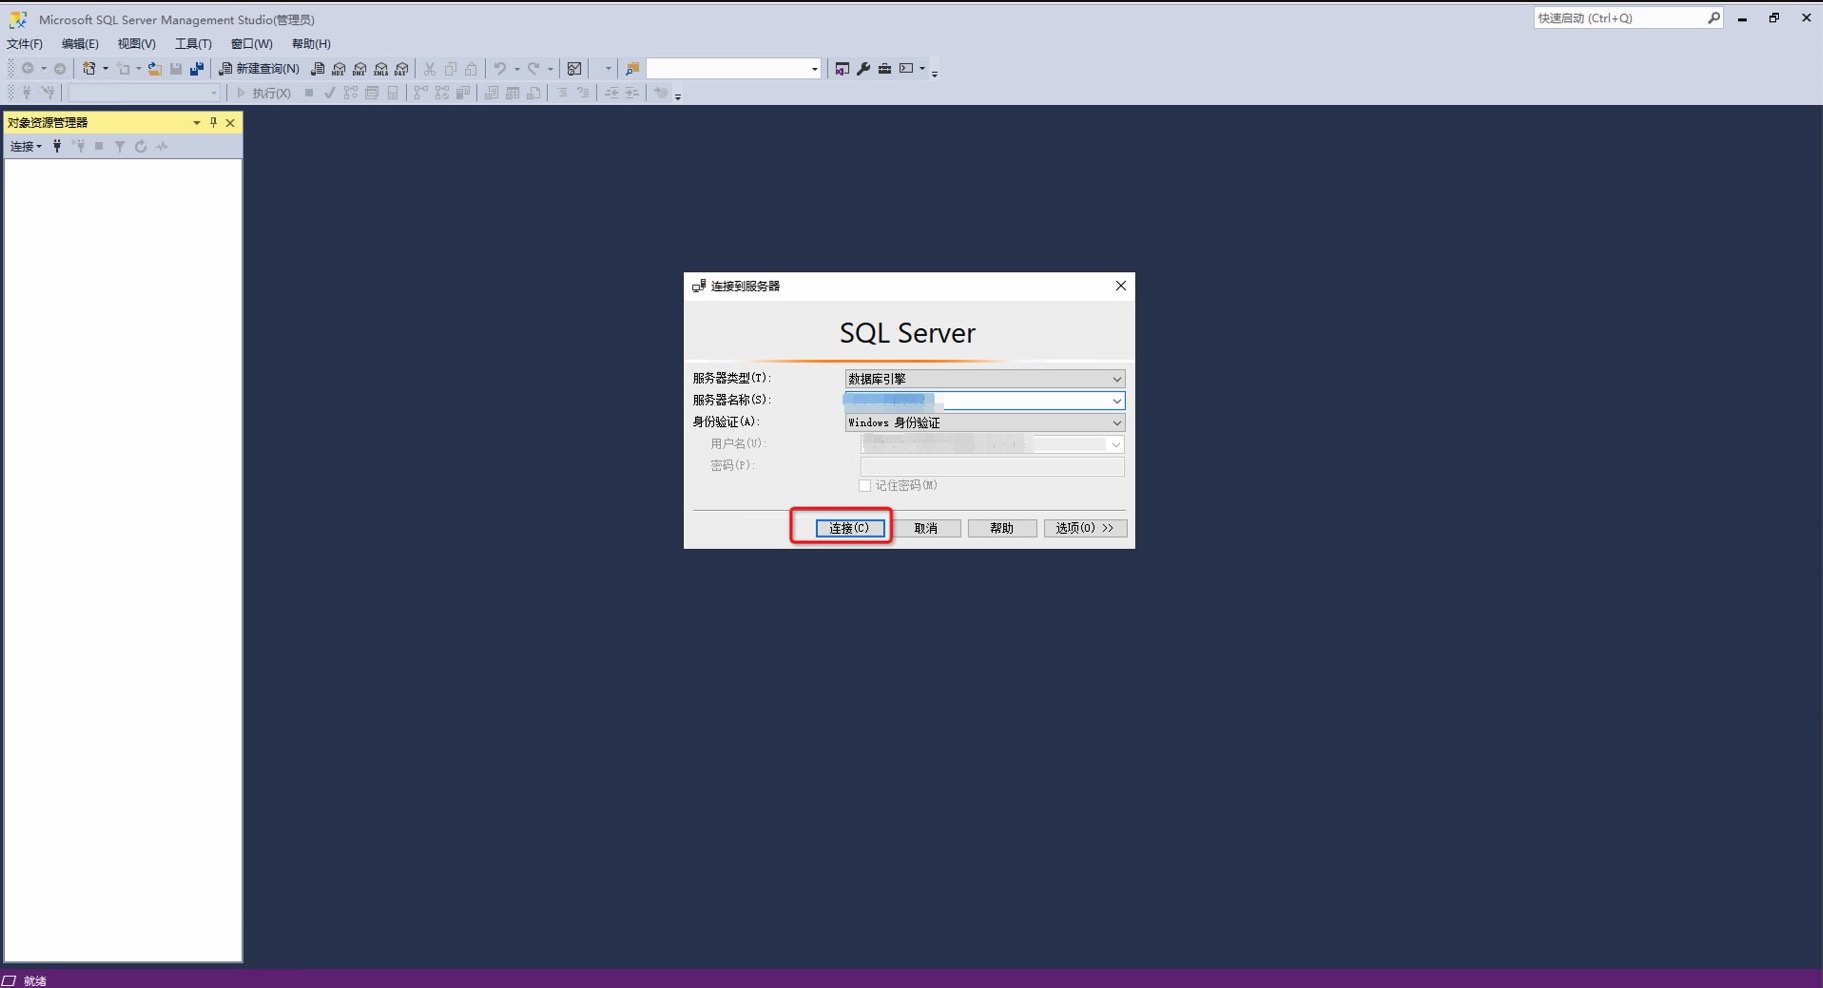
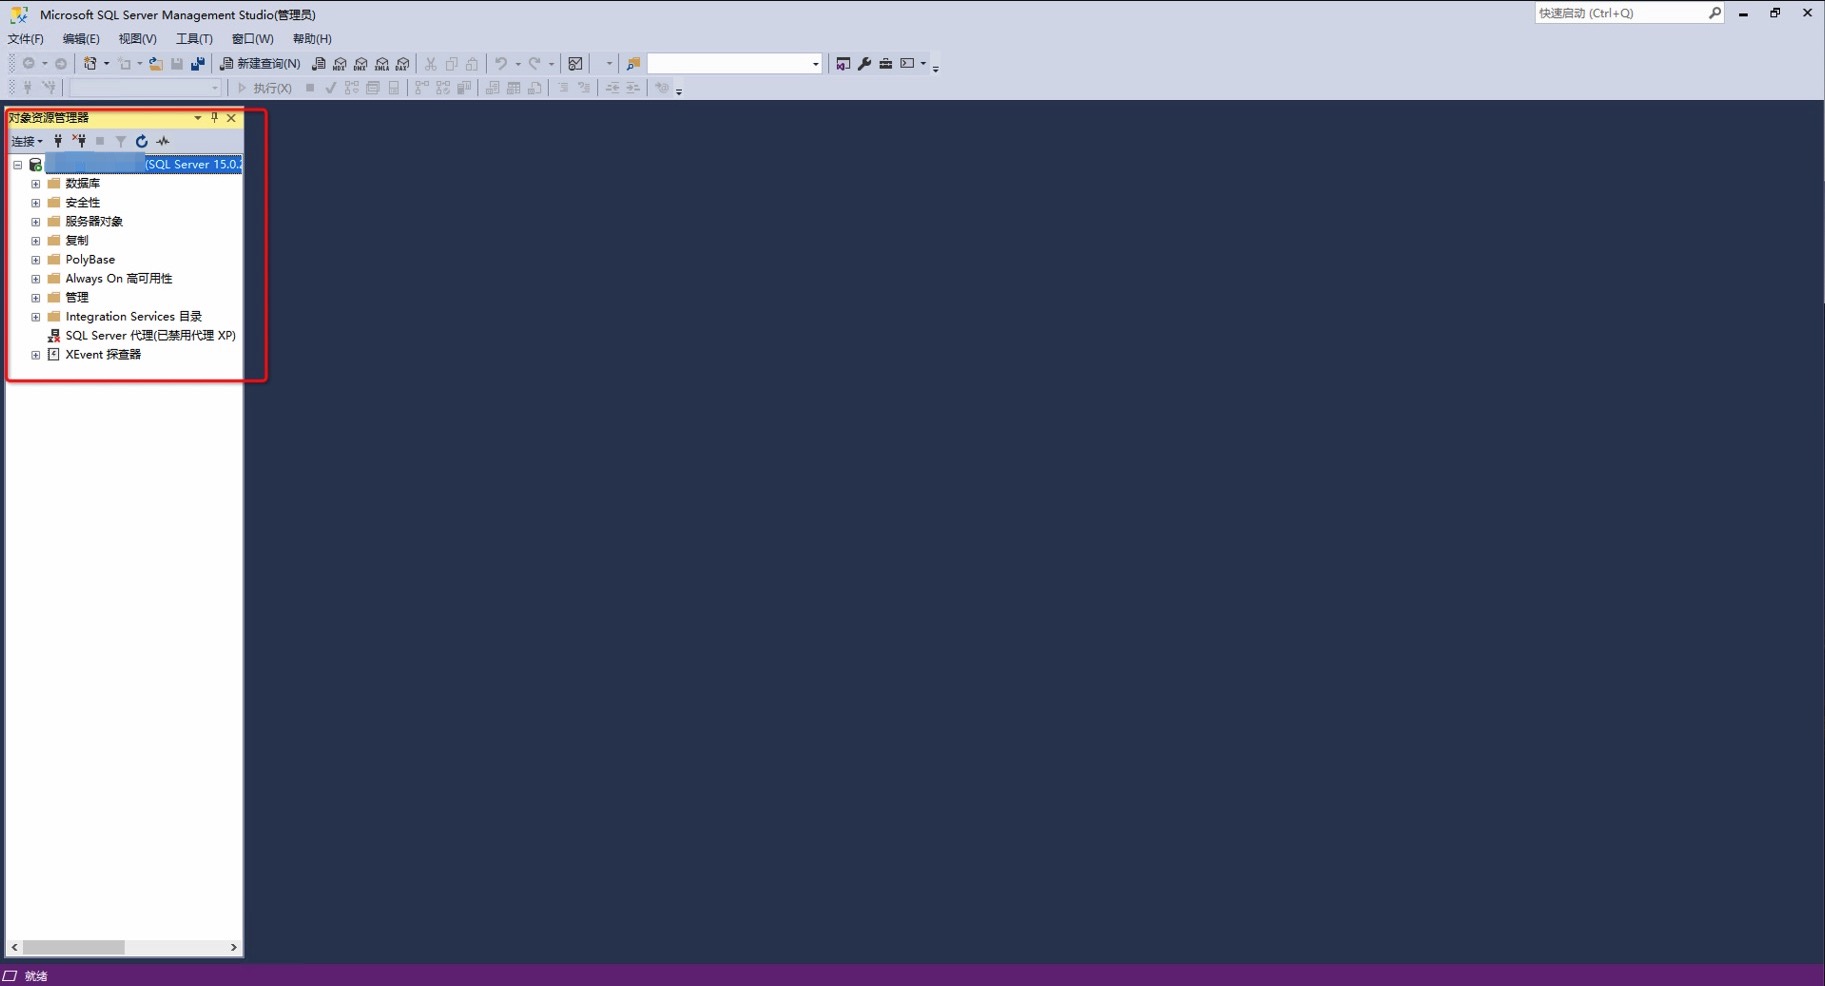
本文介绍在 ECS 服务器 Windows Server 系统中如何安装 SQL Server 。
阿里云提醒您:
-
如果您对实例或数据有修改、变更等风险操作,务必注意实例的容灾、容错能力,确保数据安全。
-
如果您对实例(包括但不限于 ECS、RDS)等进行配置与数据修改,建议提前创建快照或开启 RDS 日志备份等功能。
-
如果您在阿里云平台授权或者提交过登录账号、密码等安全信息,建议您及时修改。
安装步骤
本文以 Windows Server 2022 数据中心 64 位中文版操作系统部署 SQL Server 为例。
SQL Server 安装
-
下载安装程序。
SQL Server 根据支持不同的功能和特殊,分为企业版、标准版、Web 版、Developer 版本、Express 版,需要根据业务需求自行选择, 不同版本支持的功能与特性介绍 。本文中以部署 SQL Server 2019 Developer 版本为例,具体下载版本以官网下载页面显示为准,其它版本安装可参考同样步骤。
使用浏览器打开 SQL Server 下载地址 ,选择 立即下载 。

-
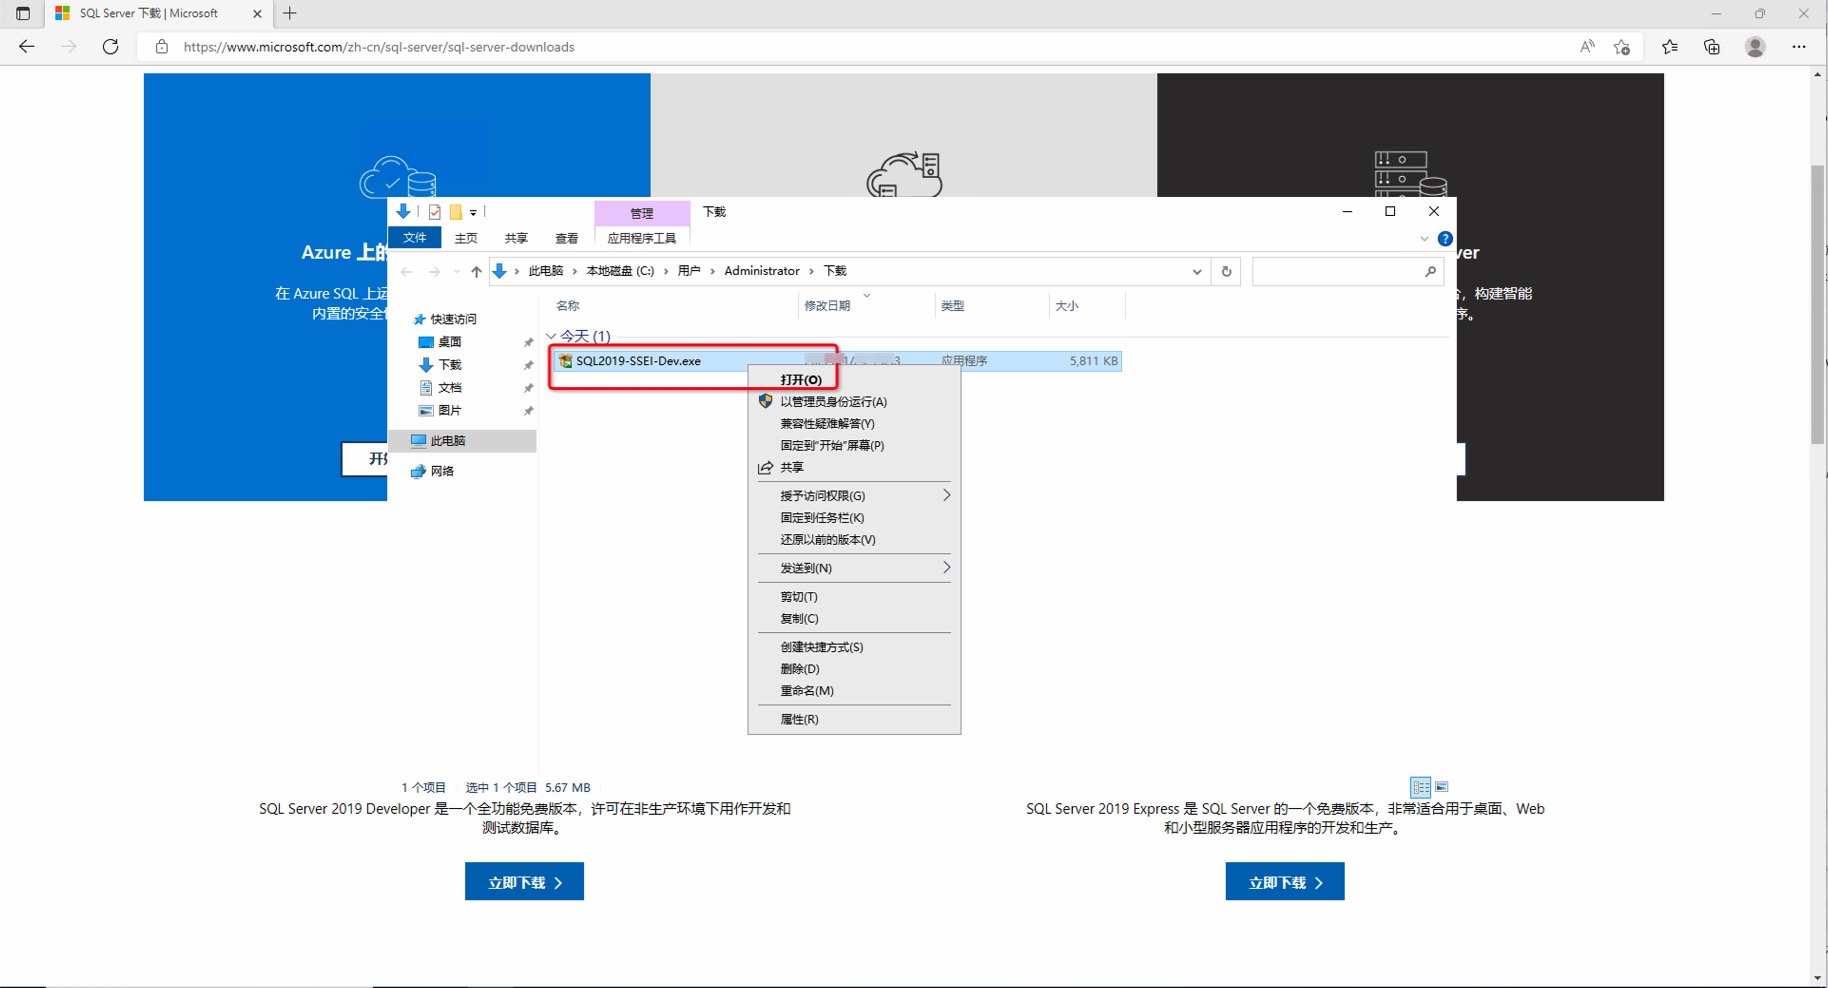
双击“SQL2019-SSEI-Dev.exe”或右键- 打开 进行程序安装。
-
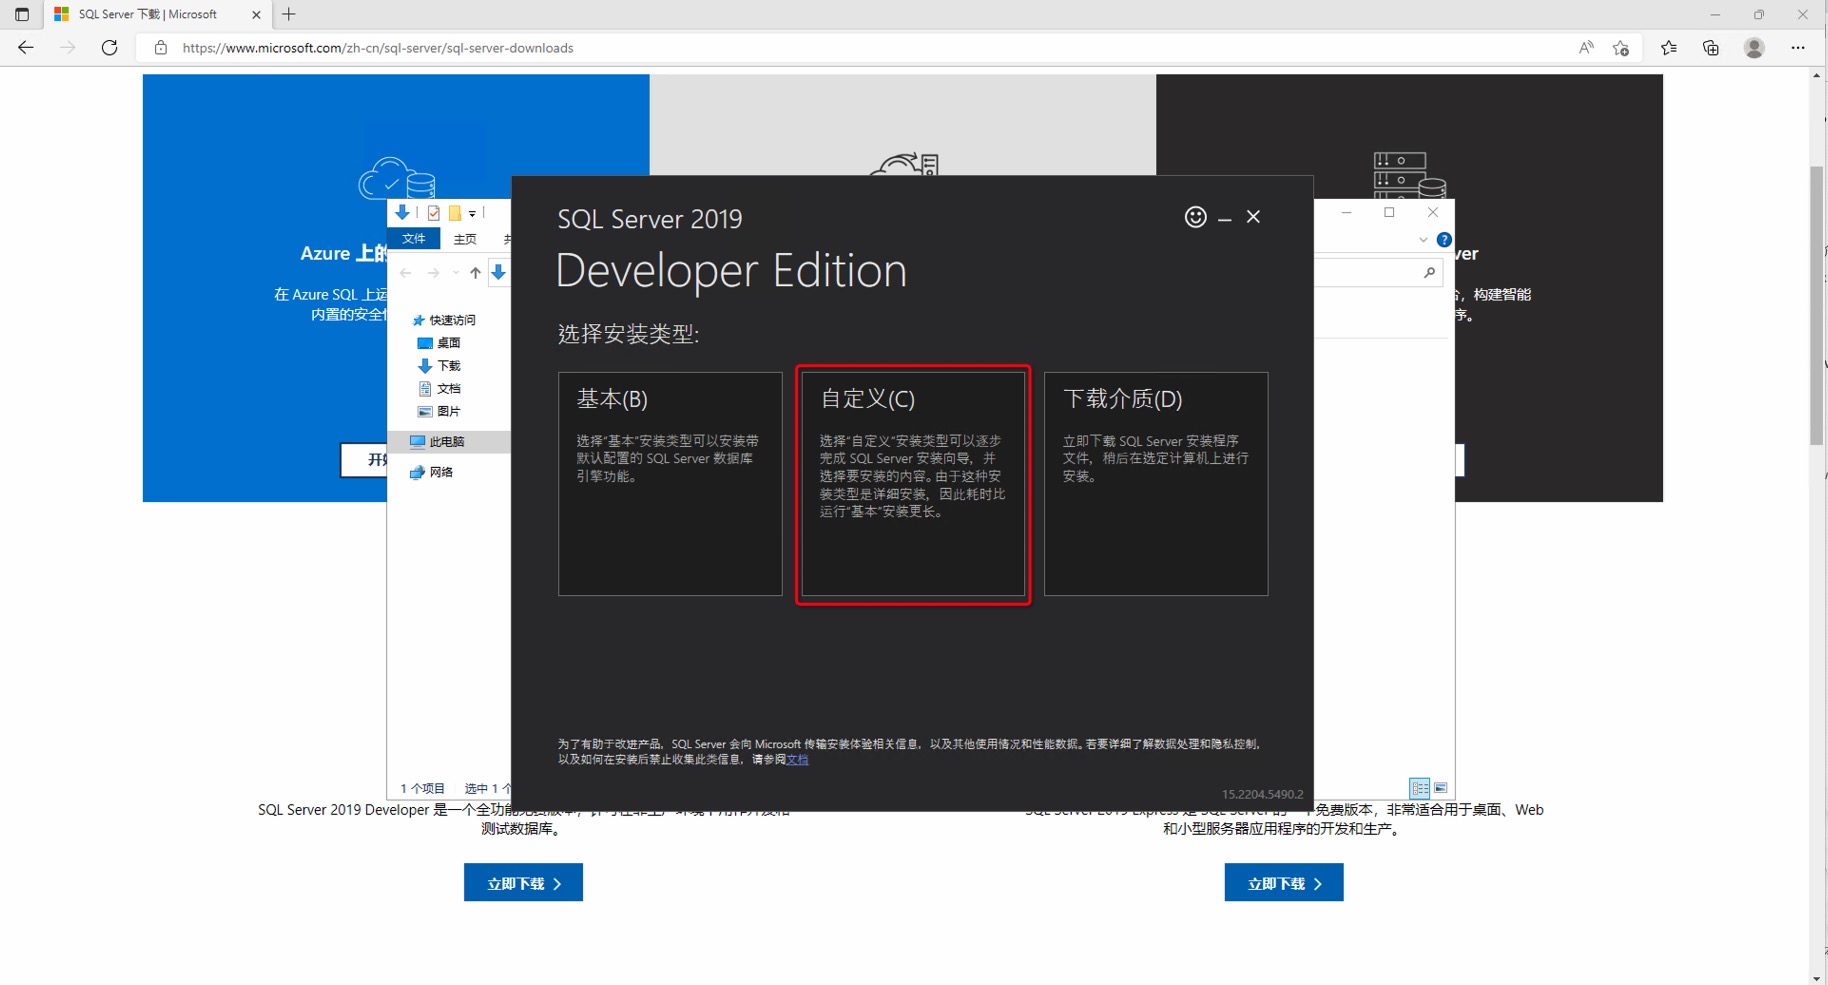
选择 自定义 。
-
根据需求选择安装软件下载位置,然后点击 安装 。
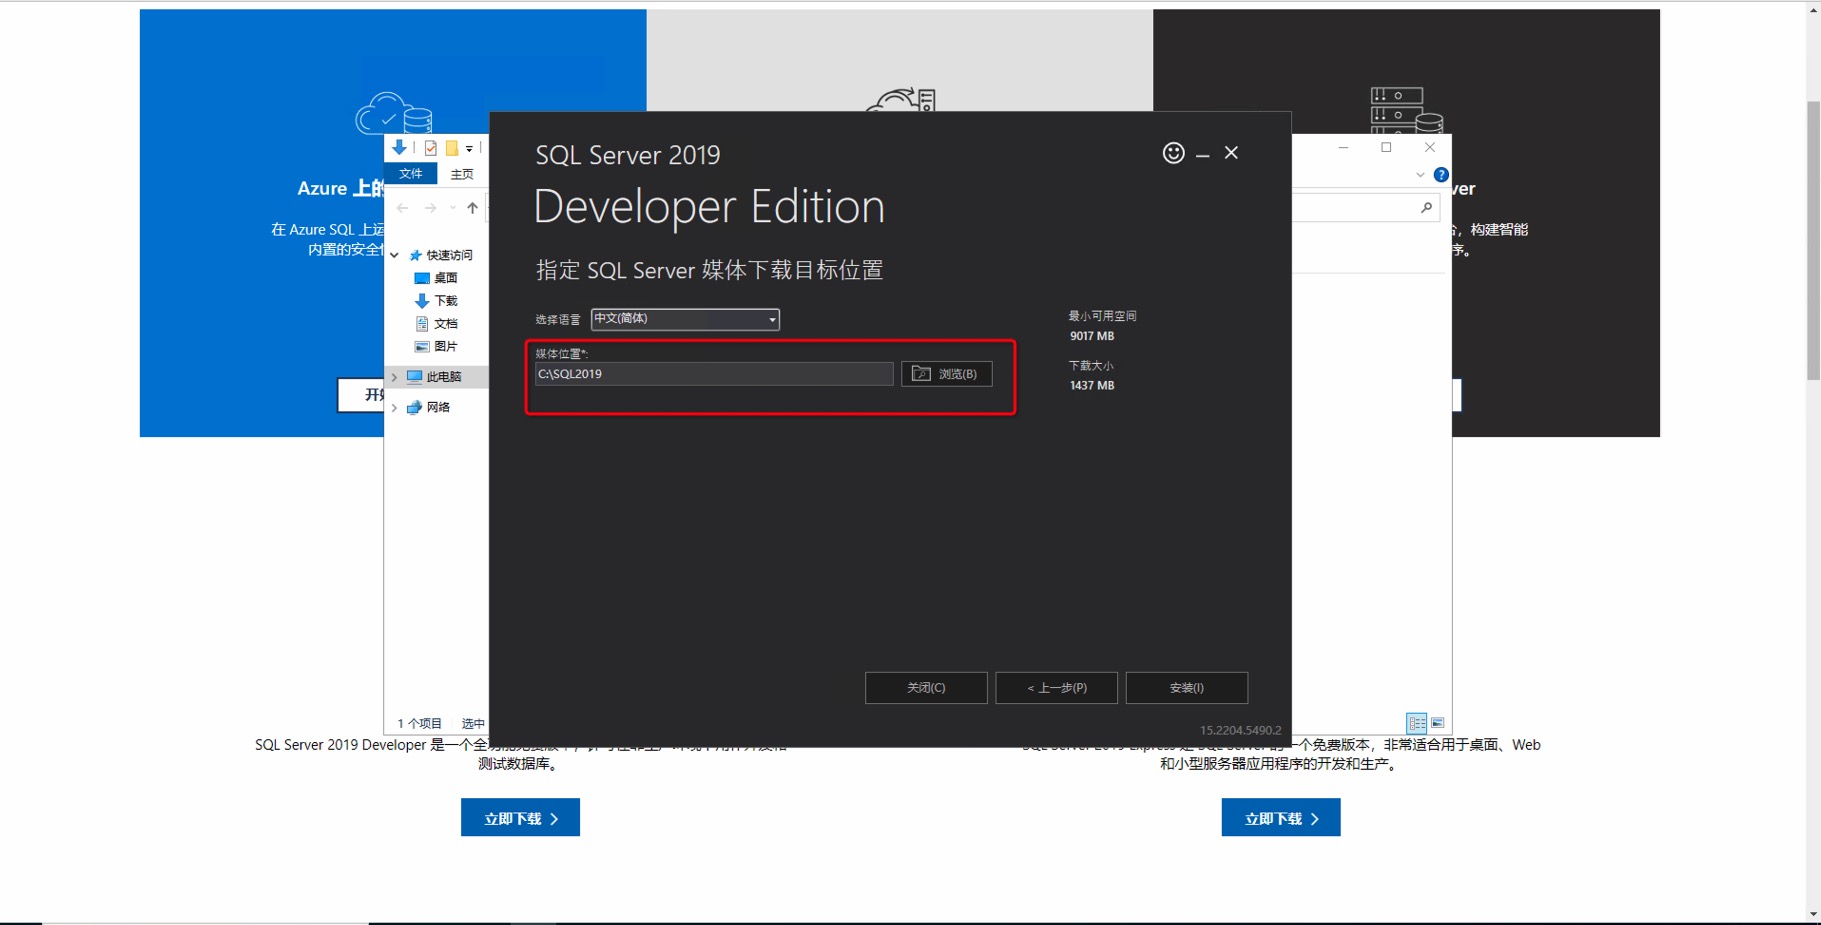
-
等待下载安装程序。
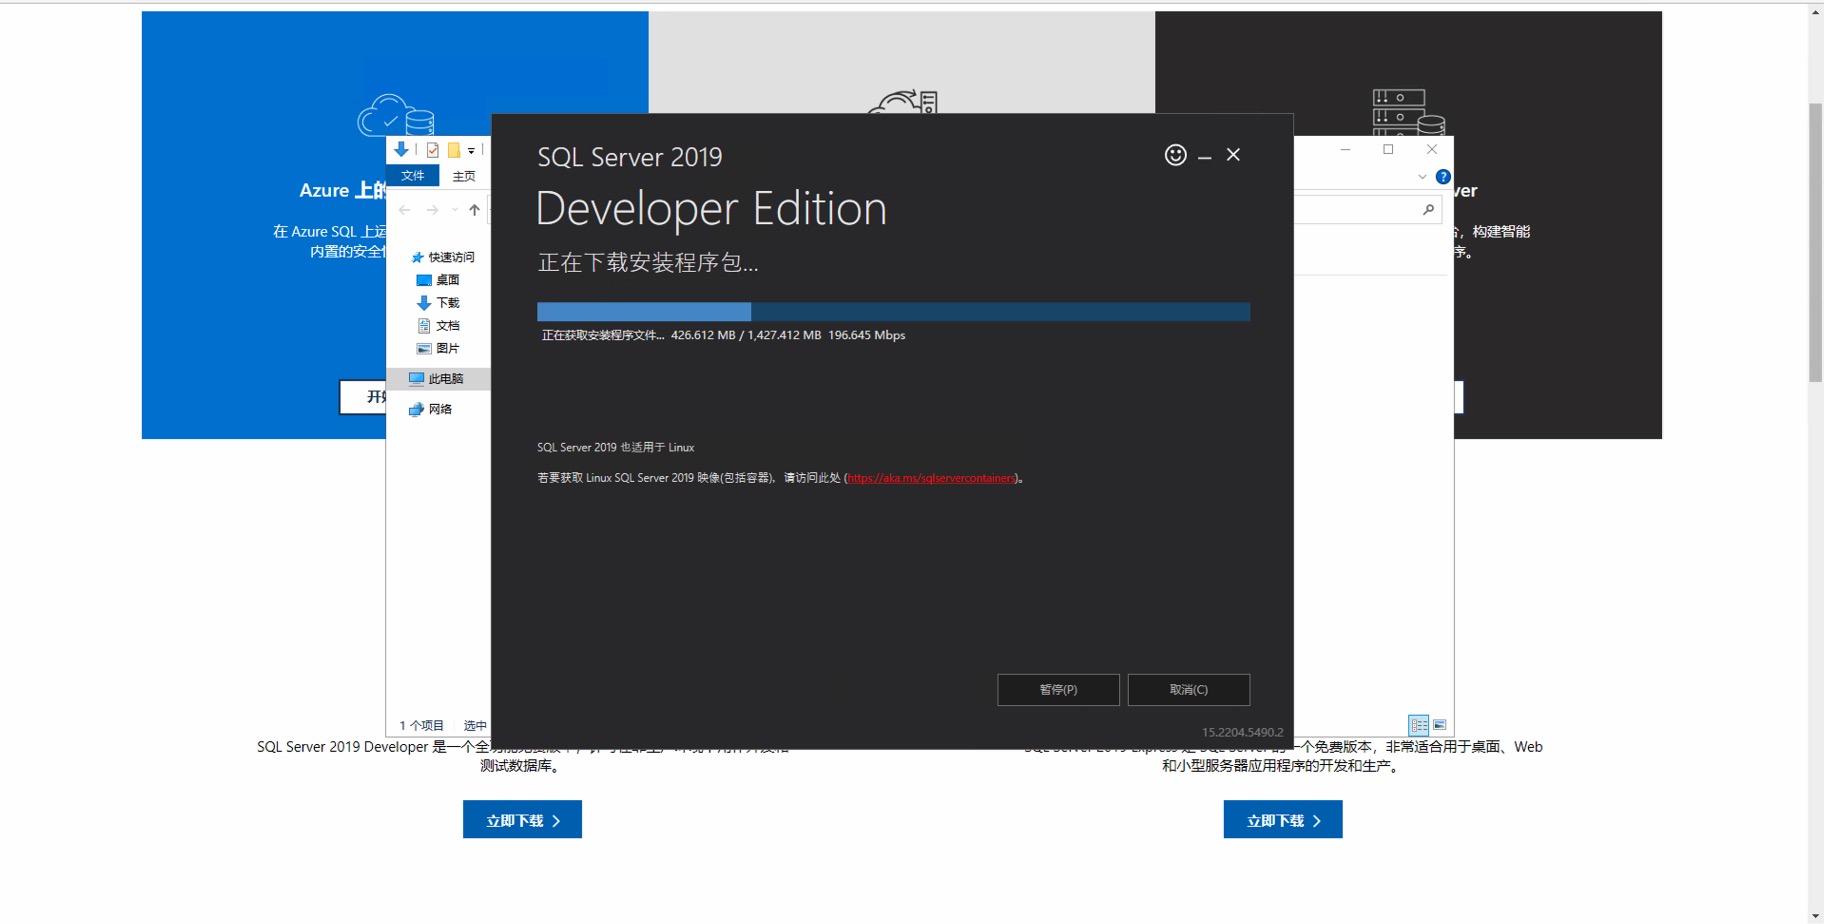
-
下载完成后,在弹出安装中心界面,选择 安装 > 全新 SQL Server 独立安装或向现有安装添加功能 。
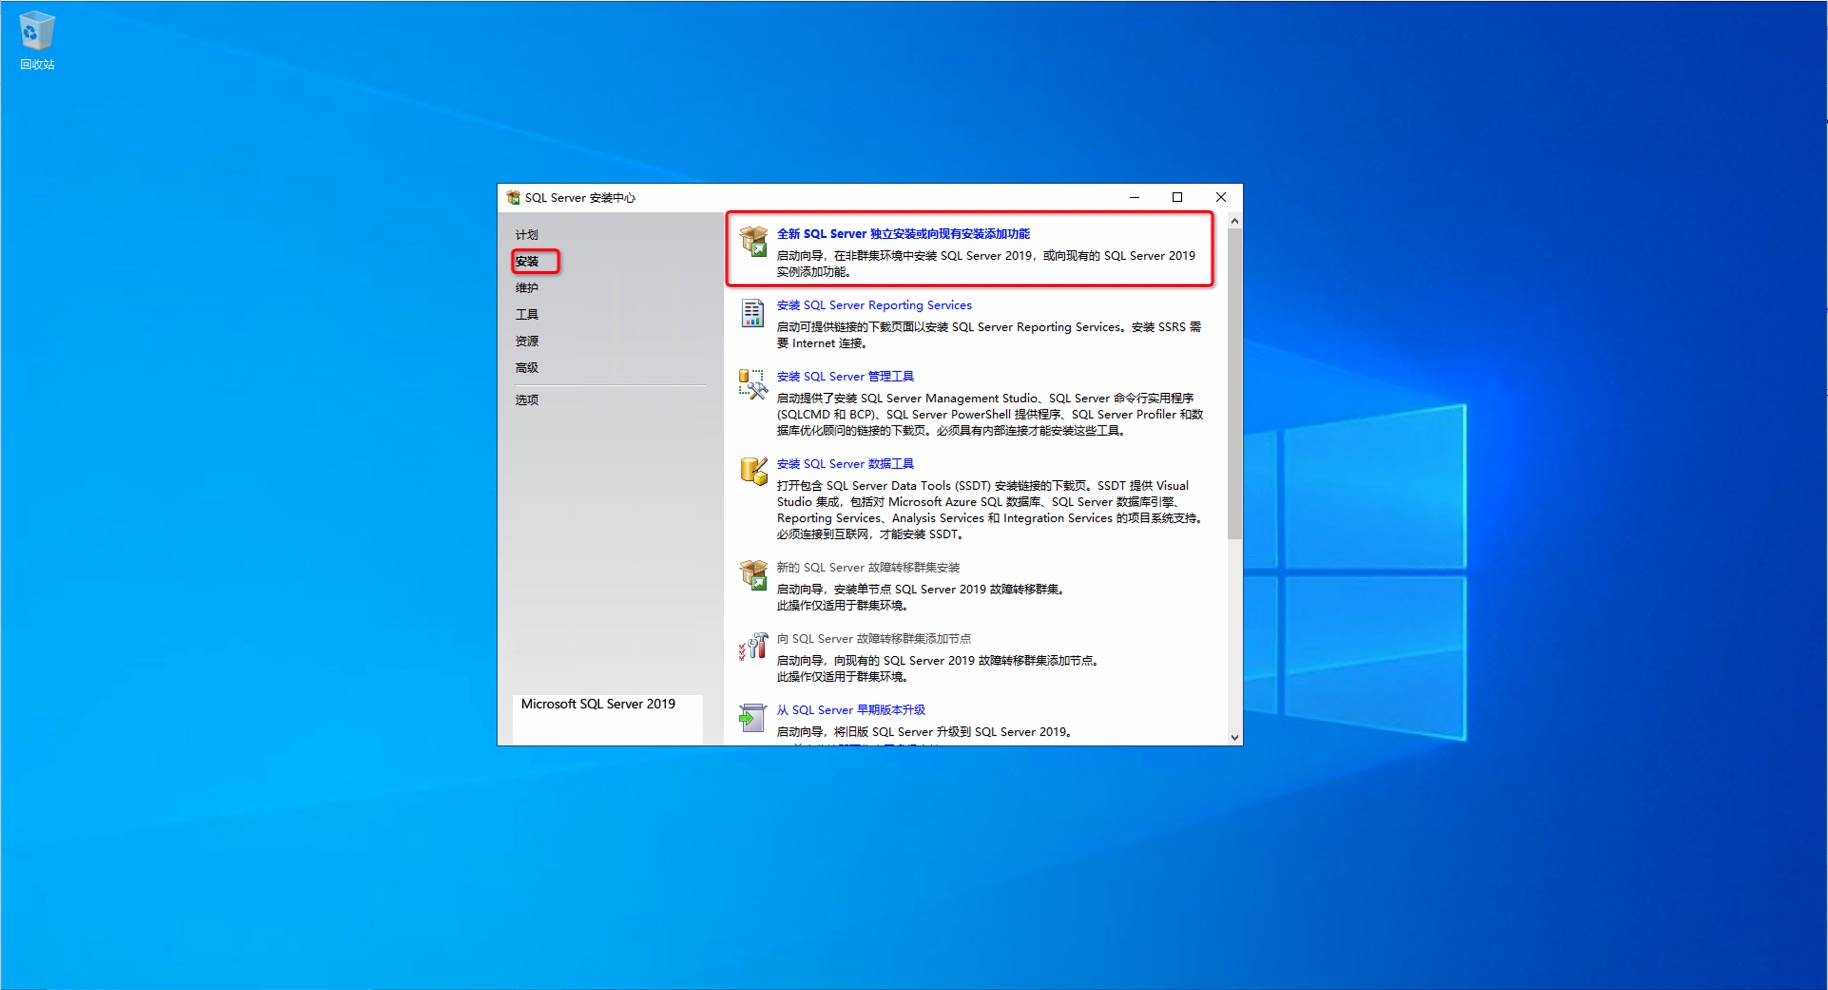
-
产品密钥 中选择安装版本(由于安装的是 Developer 免费版本,直接选择 指定可用版本 即可),然后点击 下一步 。
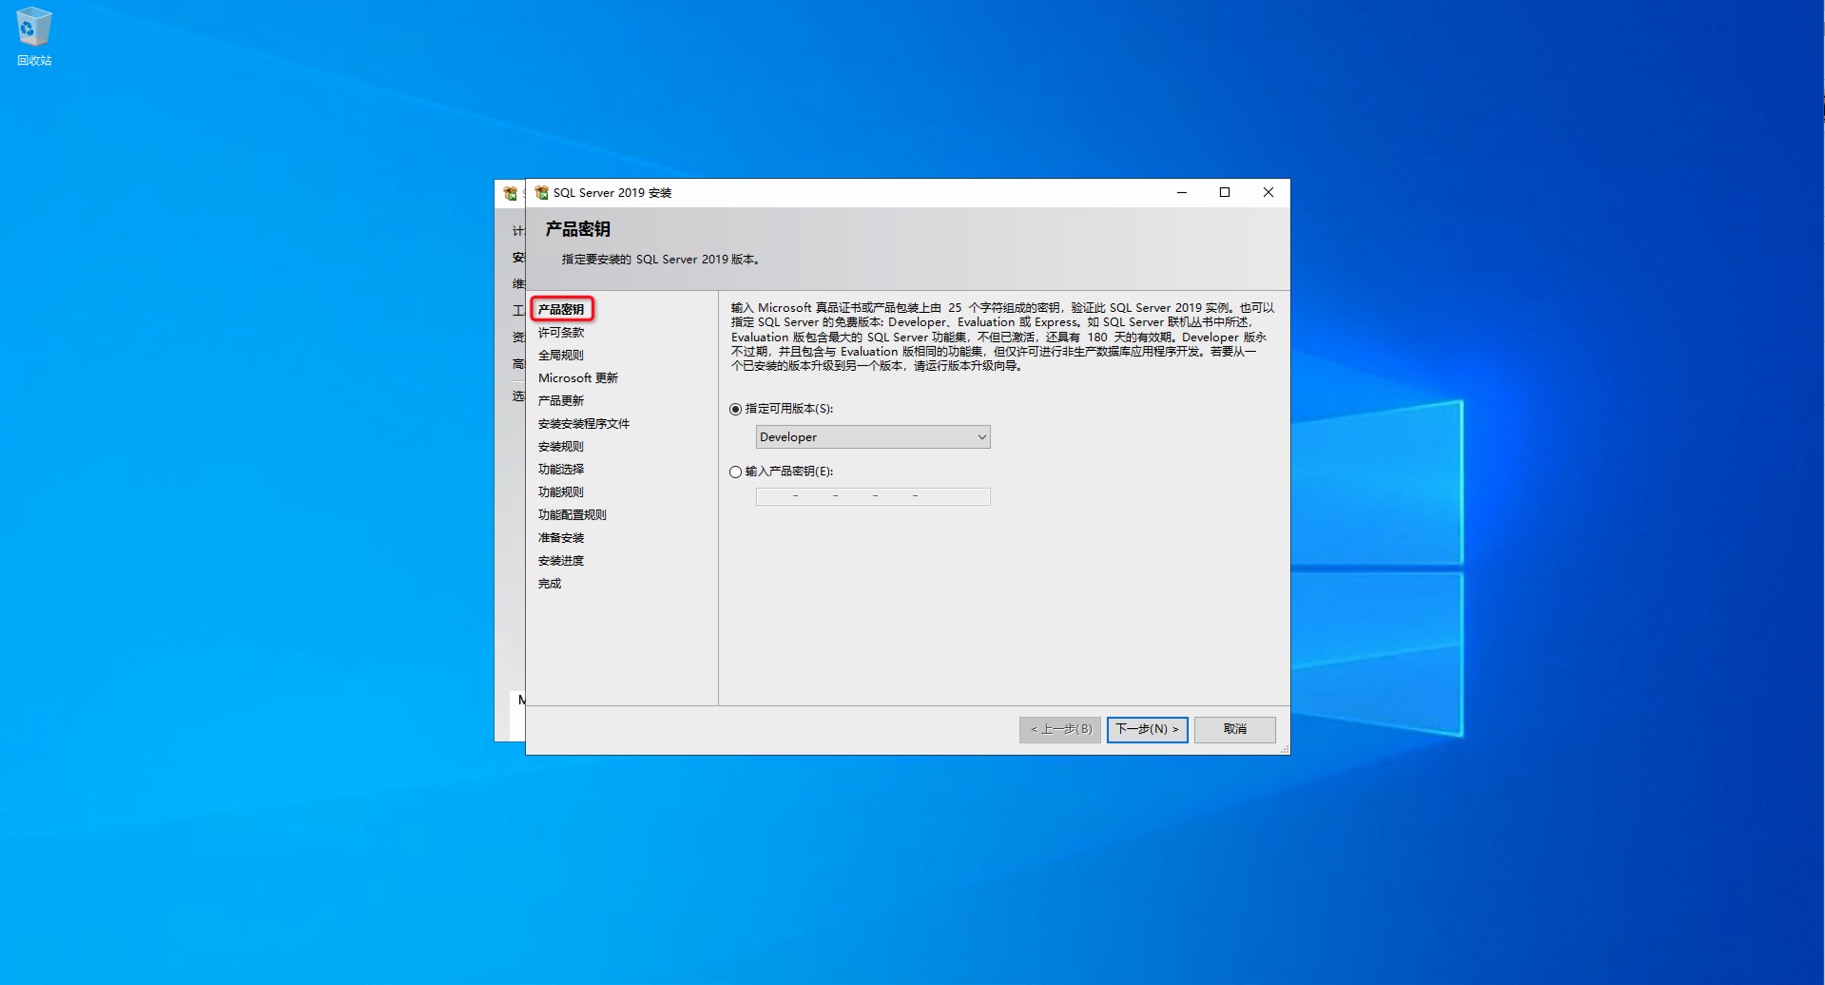
-
许可条款 中点击 我接受许可条款 ,然后点击 下一步 。
-
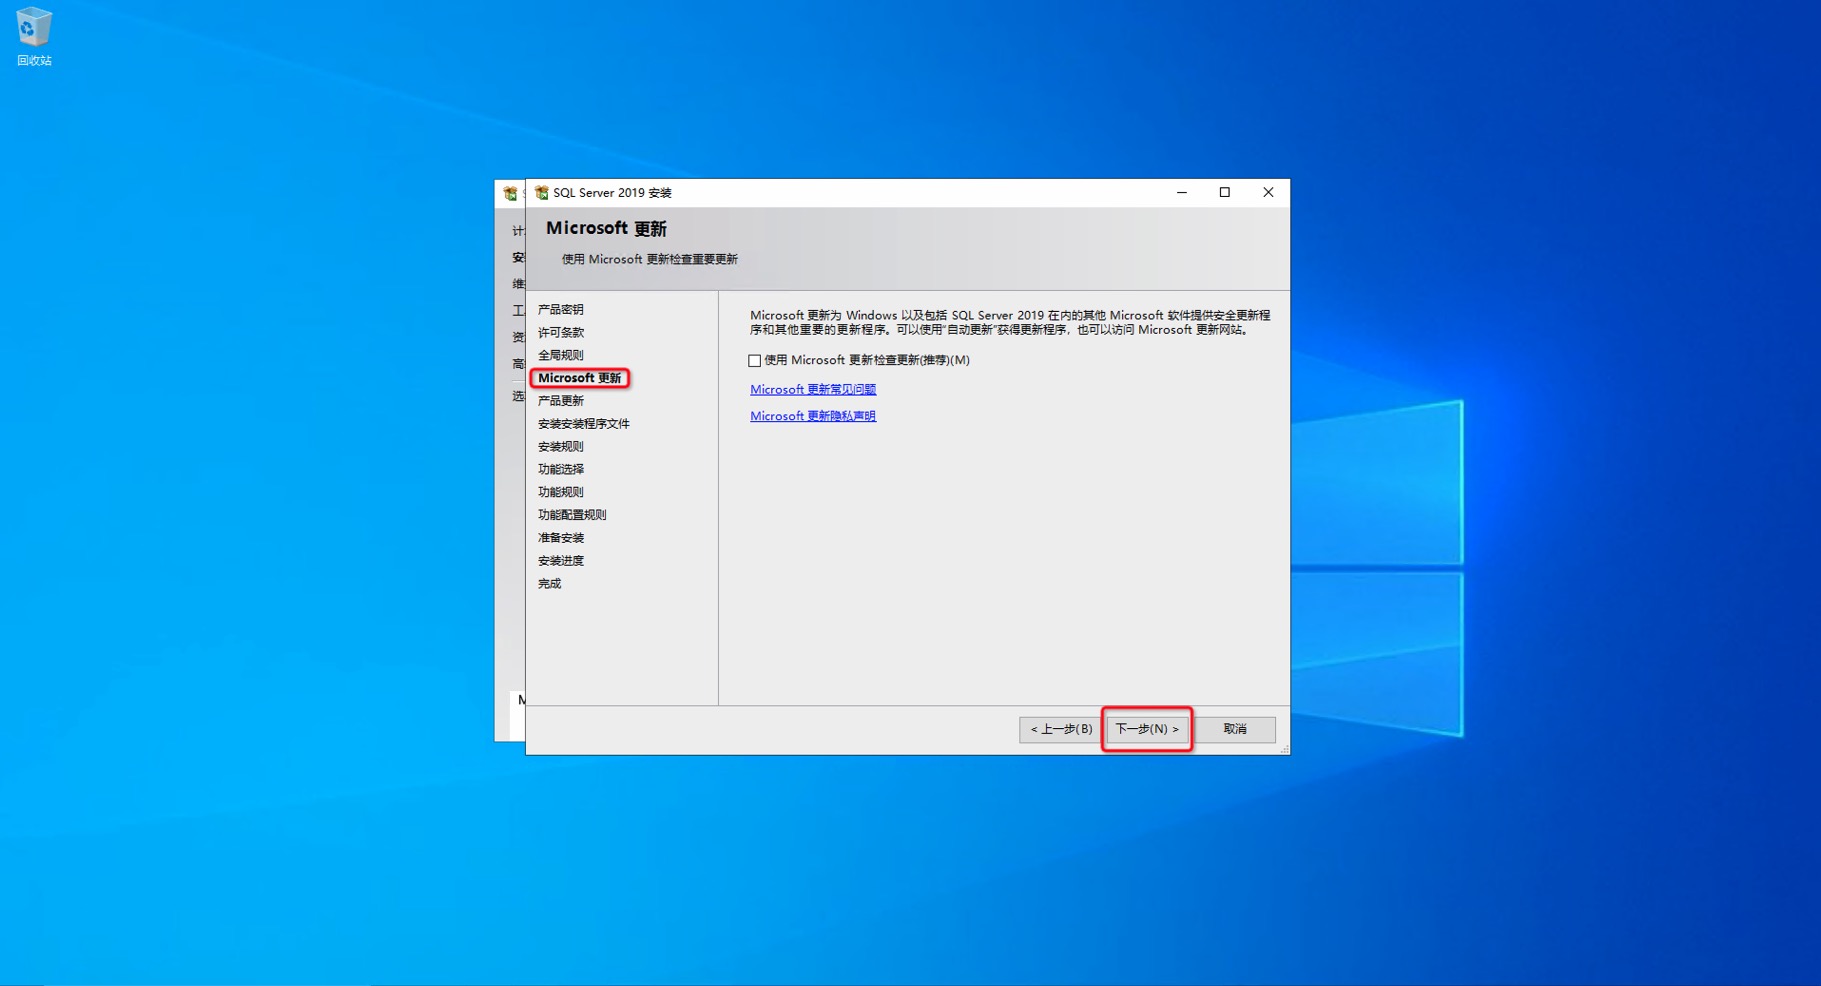
Microsoft 更新 中,点击 下一步 。
说明这里不配置自动更新,若要更新后续可以手动进行更新,避免在使用过程出现自动更新情况。
-
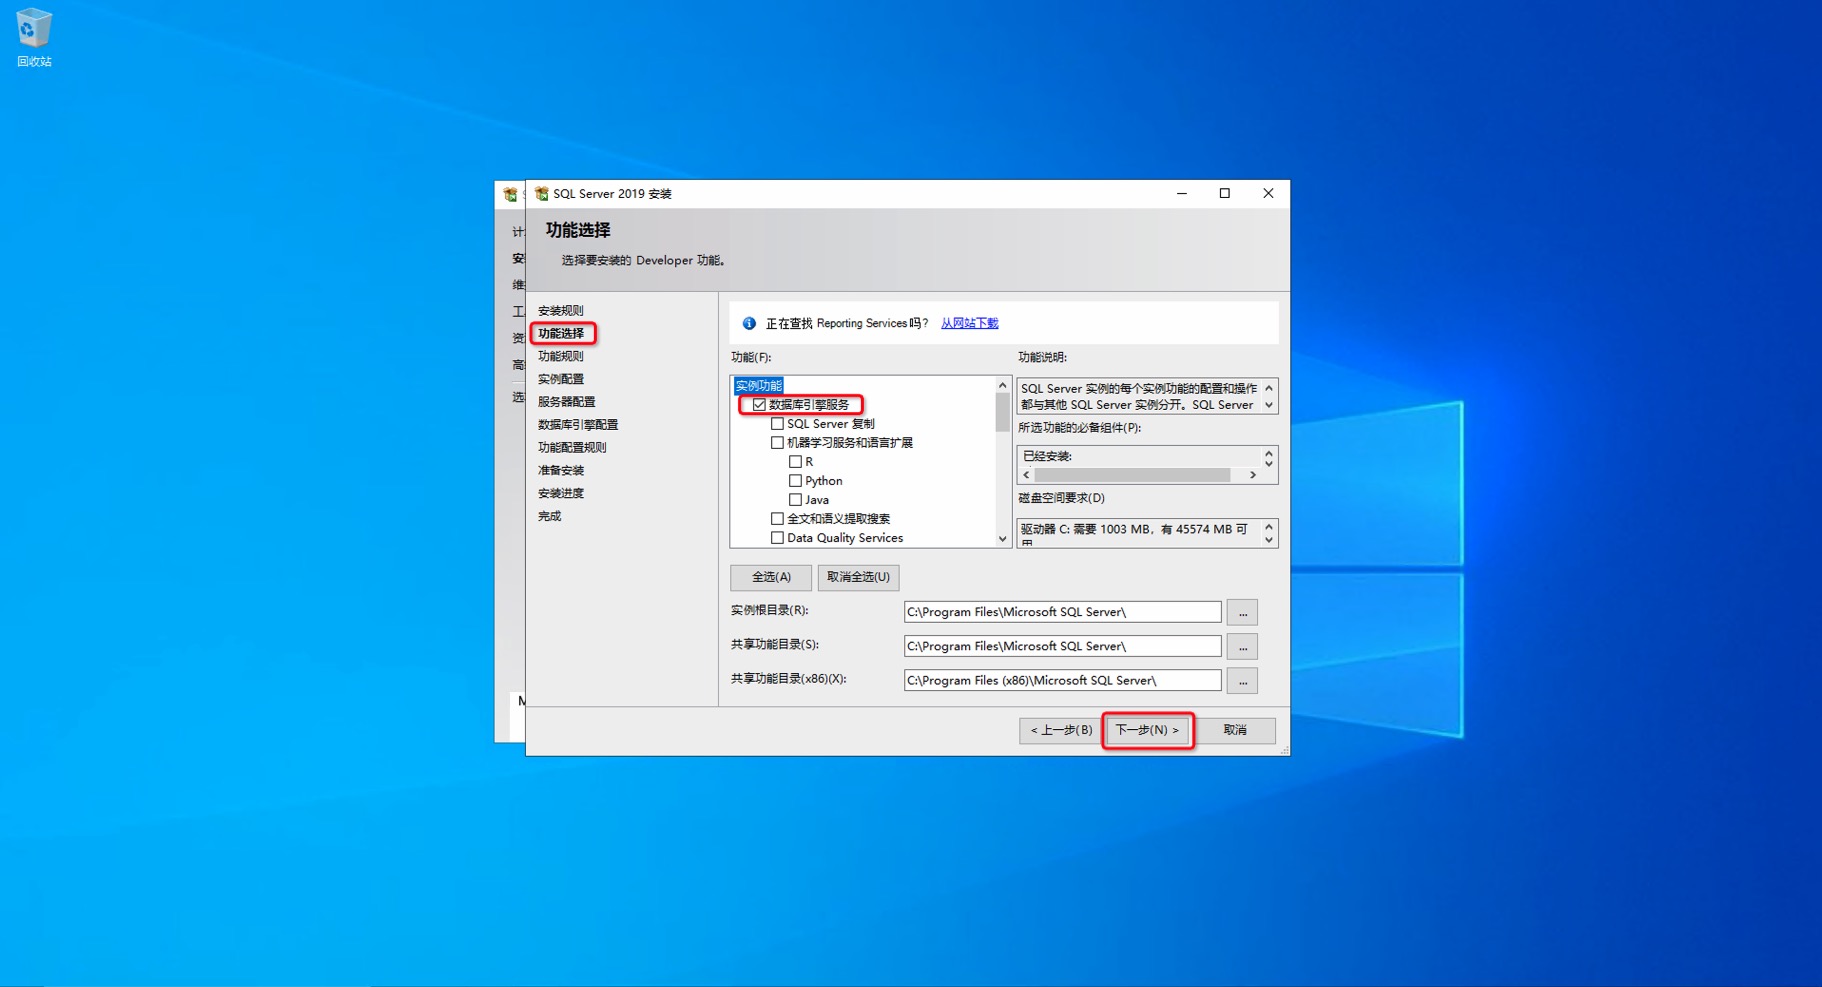
进入 功能选择 ,默认只勾选安装数据引擎服务核心功能即可。如后续需要安装相关组件可以重新按照此安装步骤,再勾选安装即可。点击 下一步 。
-
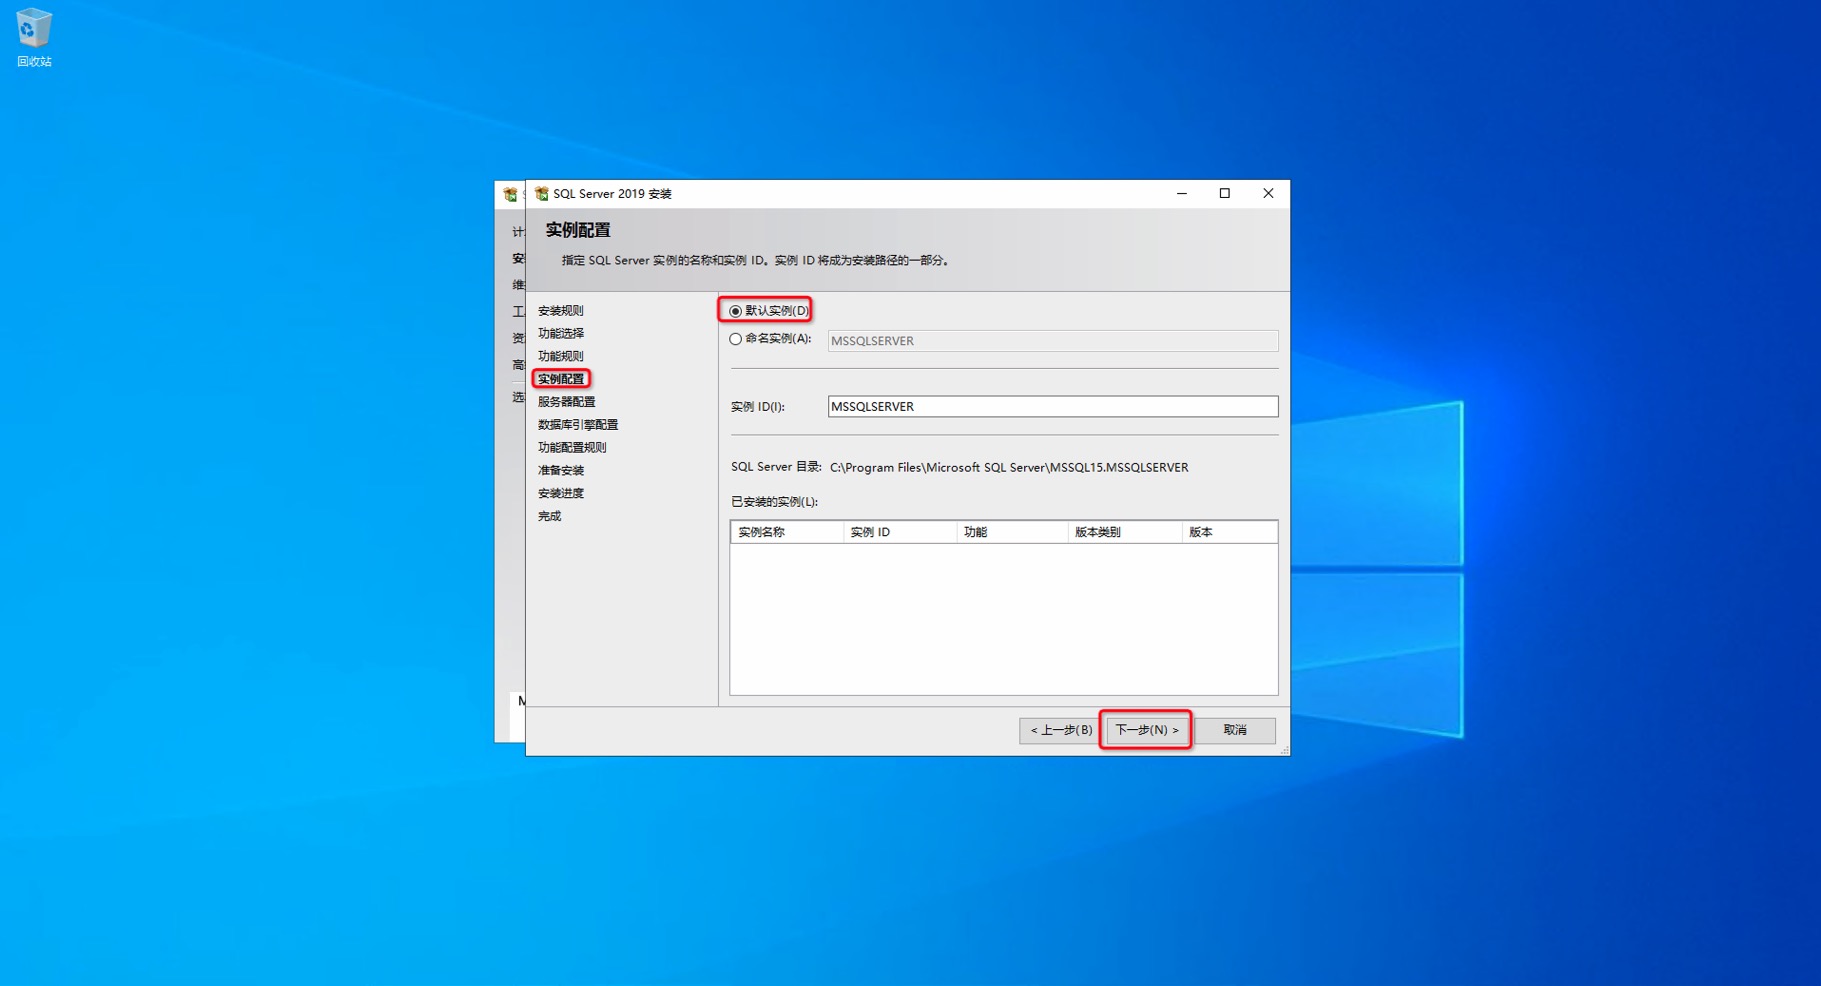
在 实例配置 中,由于是安装的第一个实例,所以选择 默认实例 即可。点击 下一步 。
-
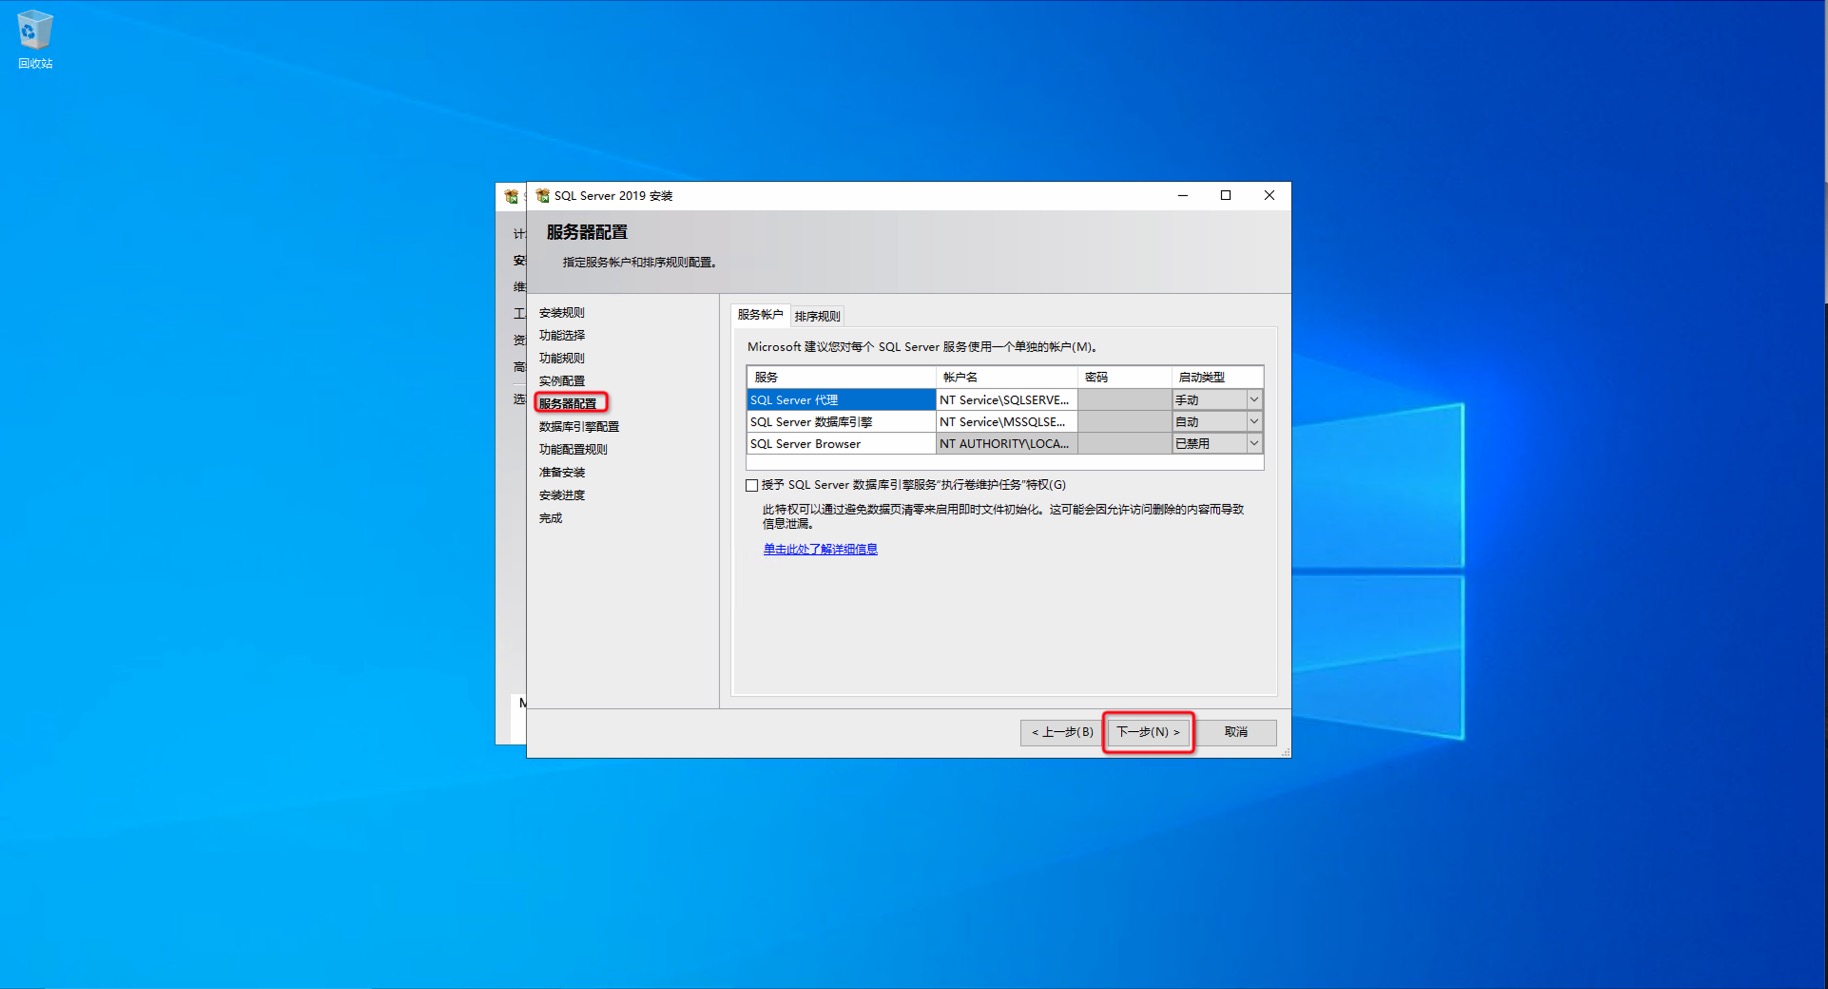
在 服务器配置 中,配置服务账号和启动类型,选择默认即可,若有其它需要可以相应的开启 SQL Server Browser 和 SQL Server Agent 服务,并配置自动启动。点击 下一步 。
-
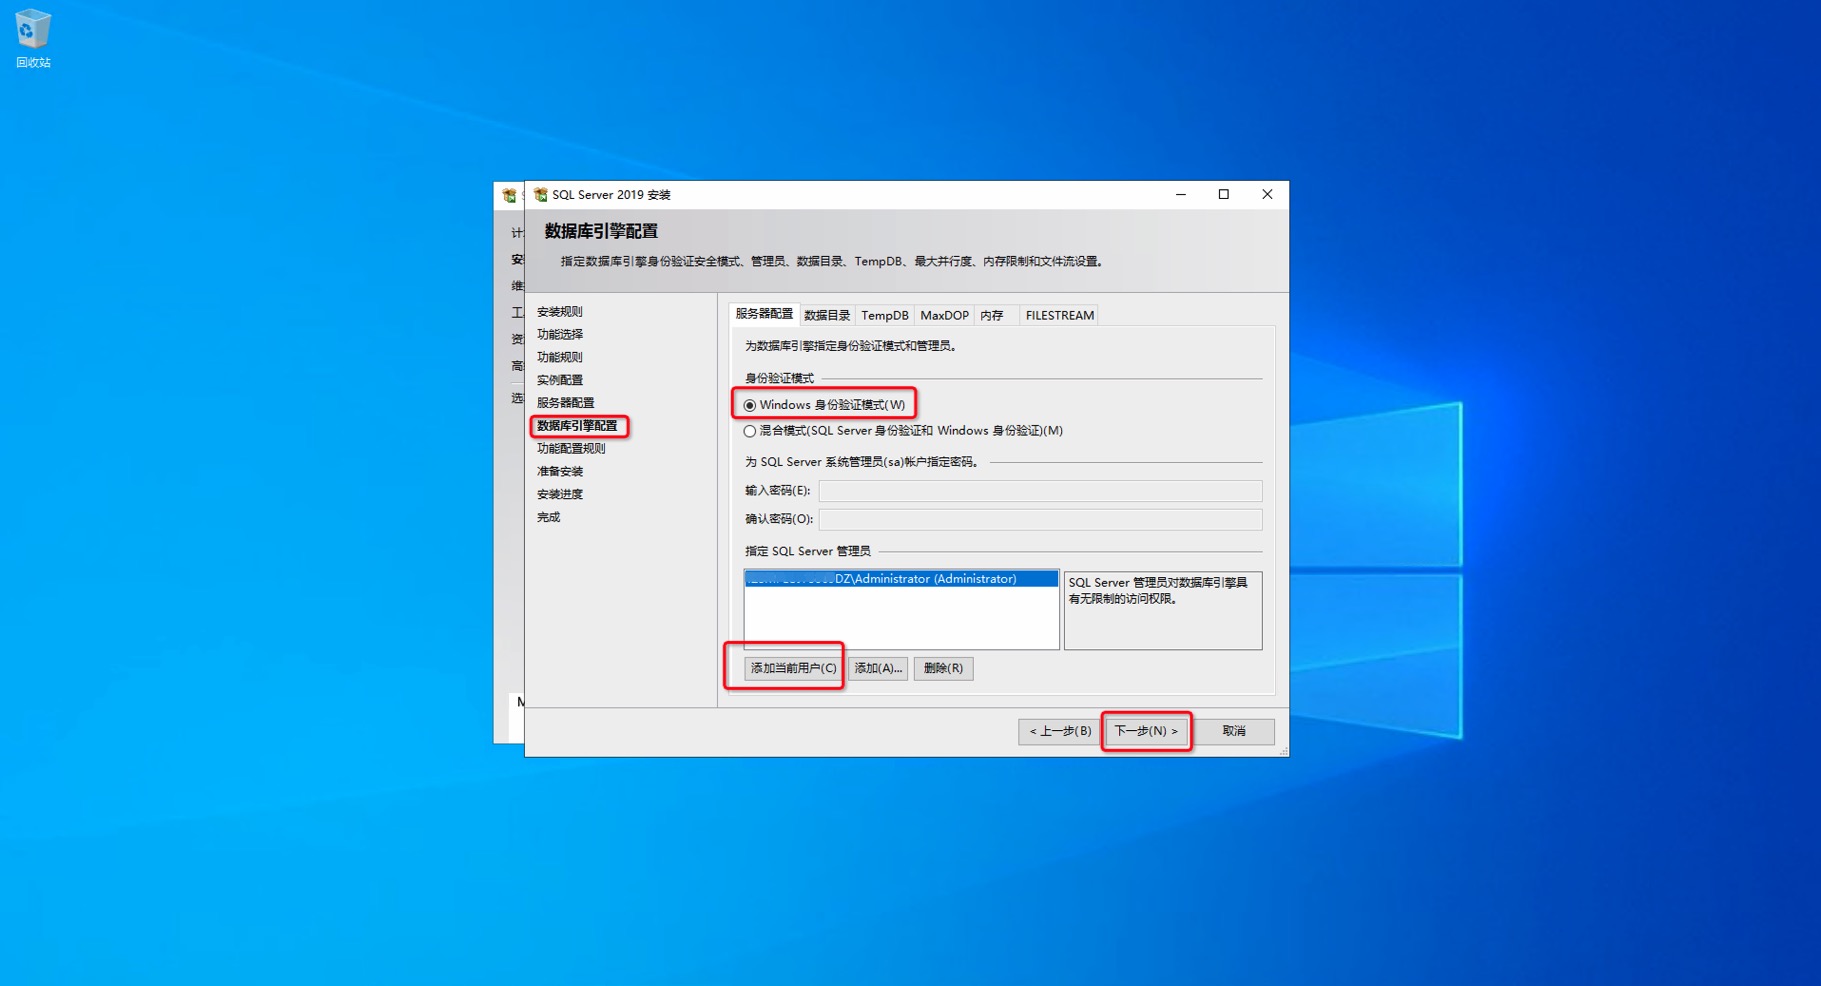
在 数据库引擎配置 中,使用默认 Windows 身份验证,安装完之后再改成混合模式即可。“ 使用 SQL Server 管理员 中,点击 添加当前用户 即可。其它配置选择默认,如有需要可以选择更改。点击 下一步 。
-
准备安装 中,点击 安装 。
-
安装完成。
SSMS 安装
-
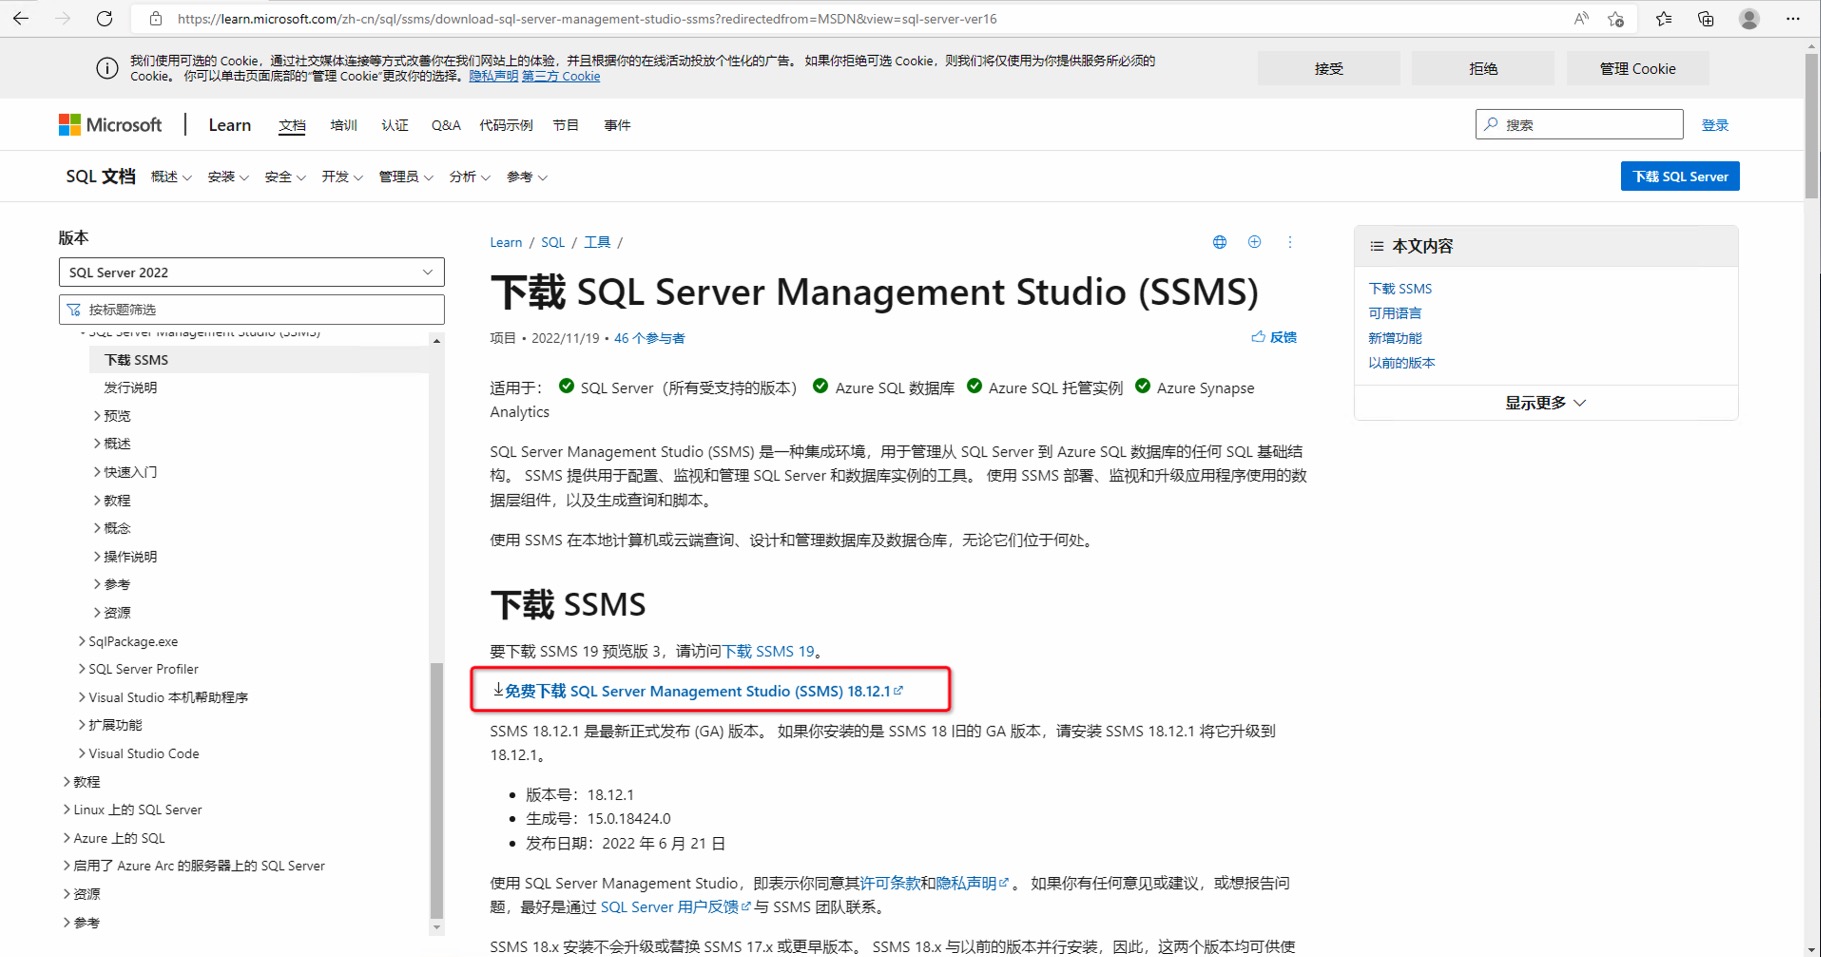
打开浏览器,下载 SSMS 安装程序 ,具体下载版本以官网下载页面显示为准,其它版本安装可参考同样步骤。
-
双击“SSMS-Setup-CHS.exe”或右键- 打开 进行程序安装。
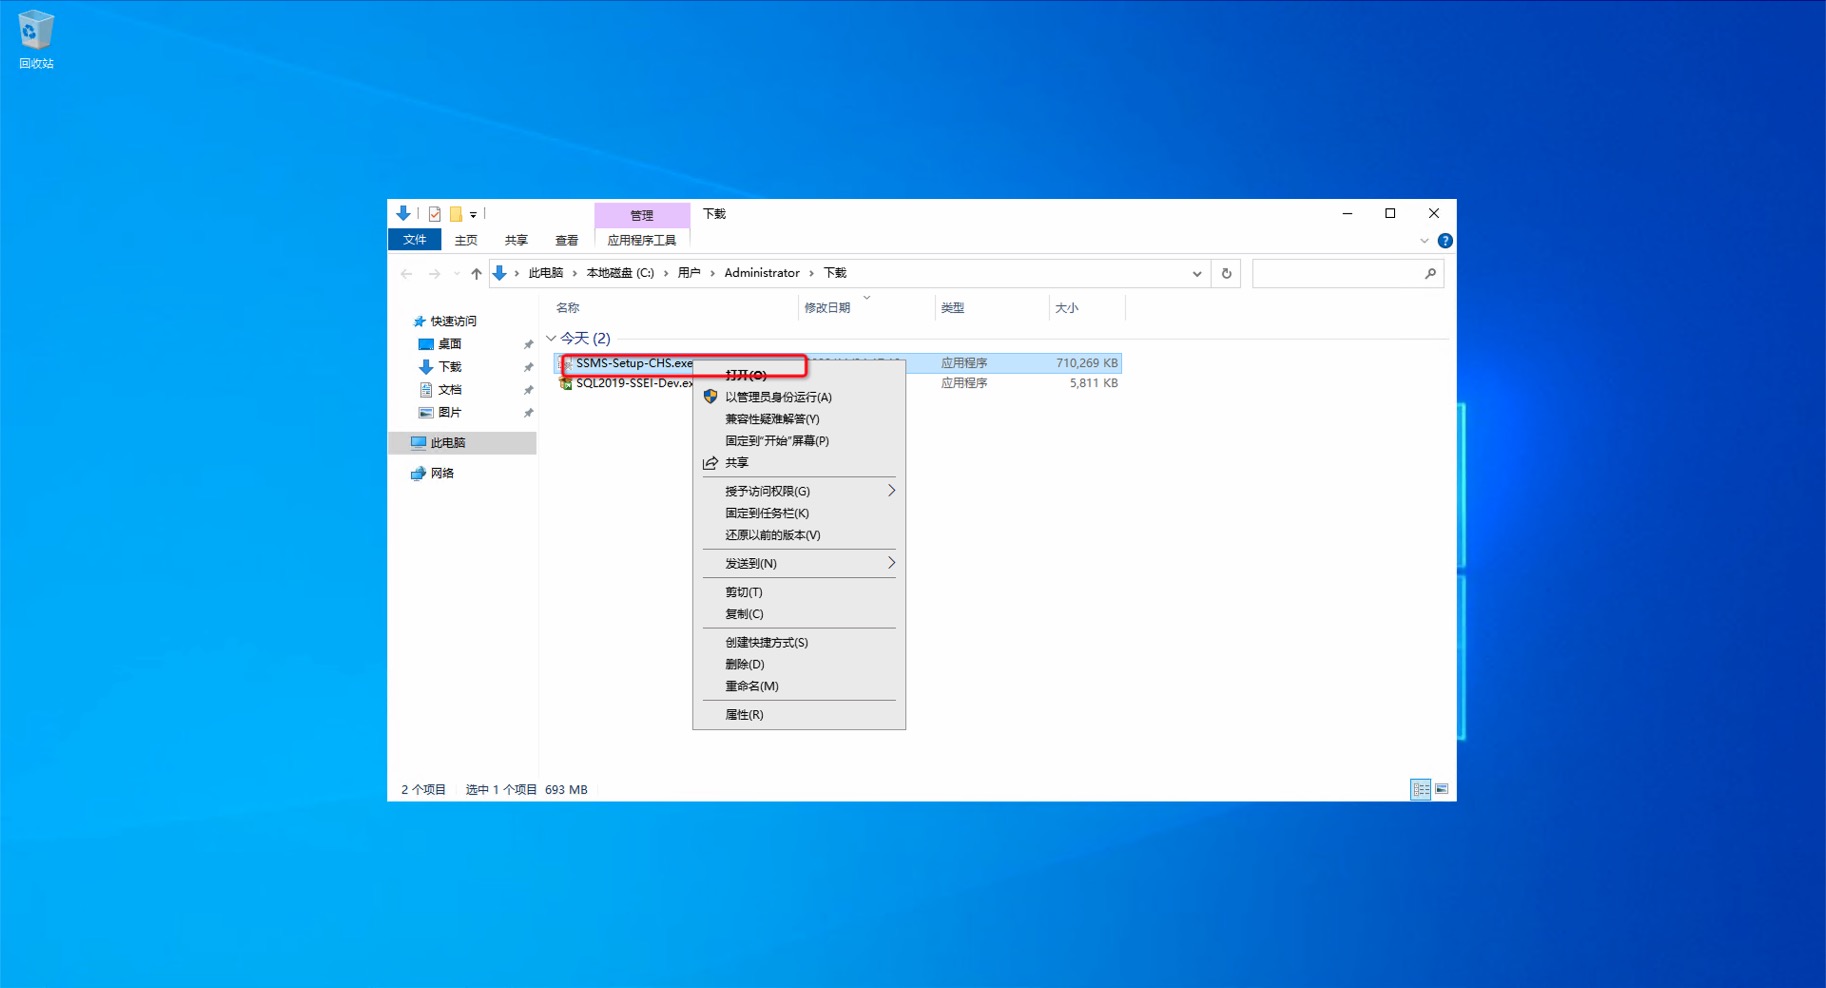
选择默认安装即可,点击 安装 。

-
安装完成,选择 重新启动 重启计算机。

-
登录系统后,点击 开始 ,打开 SSMS 客户端即可。

点击 连接 ,即可登录。
