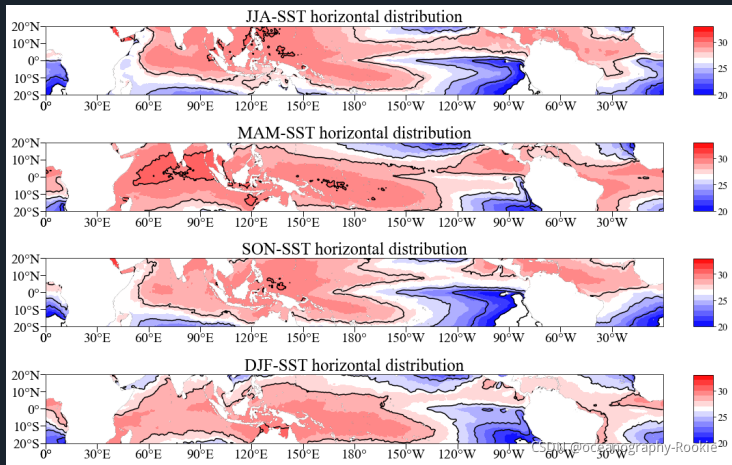
其实,通过上面的代码,我们可以发现,有部分代码完全是重复设置的,非常的麻烦,所以我们完全可以设置一个绘图函数,减少我们的代码量。
下面给出一个使用代码封装后的绘图例子,可以前后对比一下:
Created on Thu Nov 4 19:47:58 2021
@author: (ji)
E-mail : 211311040008@hhu.edu.cn
Introduction: keep learning
import cartopy.feature as cfeature
from cartopy.mpl.ticker import LongitudeFormatter, LatitudeFormatter
import matplotlib.pyplot as plt
import numpy as np
import cartopy.crs as ccrs
import xarray as xr
path2='D:\\sst.nc'
ds=xr.open_dataset(path2).sortby("lat", ascending= True)
sst=ds.sel(lat=slice(-20,20),time=slice('2010','2010'))
season =sst.groupby('time.season').mean('time', skipna=True)
def make_map(ax, title):
ax.set_extent(box, crs=ccrs.PlateCarree())
land = cfeature.NaturalEarthFeature('physical',
'land',
scale,
edgecolor='white',
facecolor='white',
zorder=2)
ax.add_feature(land)
ax.coastlines(scale)
ax.set_xticks(np.arange(0, 360+30, 30),crs=ccrs.PlateCarree())
ax.set_yticks(np.arange(-20, 30, 10),crs=ccrs.PlateCarree())
ax.xaxis.set_major_formatter(LongitudeFormatter(zero_direction_label =False))
ax.yaxis.set_major_formatter(LatitudeFormatter())
lon_formatter = LongitudeFormatter(zero_direction_label=False)
lat_formatter = LatitudeFormatter()
ax.xaxis.set_major_formatter(lon_formatter)
ax.yaxis.set_major_formatter(lat_formatter)
ax.set_title(title, fontsize=25, loc='center')
ax.tick_params(which='major',
direction='out',
length=8,
width=0.99,
pad=0.2,
labelsize=20,
bottom=True, left=True, right=False, top=False)
return ax
box = [0, 361, -20, 20]
scale = '50m'
xstep, ystep = 30, 5
cmap=plt.get_cmap('bwr')
levels=np.arange(20,34)
zorder=0
sea=['JJA','MAM','SON','DJF']
fig=plt.figure(figsize=(20,12))
plt.rcParams['font.family'] = 'Times New Roman'
plt.rcParams['font.size'] = 15
proj=ccrs.PlateCarree(central_longitude=180)
count=0
for i in range(len(sea)):
count+=1
ax=fig.add_subplot(4,1,count,projection=proj)
make_map(ax,sea[i]+'-SST horizontal distribution')
plot=ax.contourf(sst.lon,sst.lat,season.sel(season=sea[i]).sst,cmap=cmap,levels=levels,\
zorder=0,transform=ccrs.PlateCarree())
contour=ax.contour(sst.lon,sst.lat,season.sel(season=sea[i]).sst,colors='k',zorder=1,transform=ccrs.PlateCarree())
fig.colorbar(plot,ax=ax,shrink=0.7,ticks=[20,25,30],pad=0.04,aspect=3.5)
plt.show()
结果是一样的:

可以明显的发现,代码更简洁了,也可以将这个封装函数进行保存,以后直接导入这个函数,大大节省我们绘图时间!!!
有兴趣的小伙伴们可以尝试一下~
测试数据有点大,不方面传在这里,有需要的找我要
一个努力学习python的海洋
水平有限,欢迎指正!!!
欢迎评论、收藏、点赞、转发、关注。
关注我不后悔,记录学习进步的过程~~
一般来说,我们研究分析一些海温或者降水等要素的的变化规律时,通常会进行季节特征变化分析,这就需要我们绘制不同季节的空间分布图来进行分析,这就需要我们掌握子图的绘制方法。绘图进阶学习ax绘制不同子图通过绘图函数封装绘制不同子图一般这种我们可以通过设置不同的ax进行绘制,简单介绍在这篇博客中:进阶绘图–axes通过对于每个子图的不同命令,可以绘制填色图、折线图等等,这种方法的不好的地方在于需要多次重复一些语句设置,比如地形、坐标、标签等等,当然,如果不怕麻烦也可以忽略。对于不同的子图,只需要对于不同的
如何解决 conda install 库时报错:The environment is inconsistent, please check the package plan carefully
18650

