各位朋友大家好,今天来讲一下LSTM时间序列的预测进阶。
现在我总结一下常用的LSTM时间序列预测:
1.单维单步(使用前两步预测后一步)

可以看到trainX的shape为 (5,2) trainY为(5,1)
在进行训练的过程中要将trainX reshape为 (5,2,1)(LSTM的输入为 [samples, timesteps, features]
这里的timesteps为步数,features为维度 这里我们的数据是1维的)
2.单维多步(使用前两步预测后两步)

可以看到trainX的shape为 (4,2) trainY为(4,2)
同样的,在进行训练的过程中要将trainX reshape为 (5,2,1)
3.多维单步(使用前三步去预测后一步)

可以看到trainX的shape为 (4,3,2) [samples = 4, timesteps =3, features = 2] trainY为(4,2)
4.那么切入正题,我们进行多维多步的预测(使用前三步去预测后两步)

可以看到trainX的shape为 (3,3,2) trainY为(3,2,2)
那么问题来了。使用LSTM进行时间序列预测的网络结构如下:
model = Sequential()
model.add(LSTM(
input_shape=(trainX.shape[1], trainX.shape[2]),
return_sequences=True))
model.add(Dropout(config.dropout))
model.add(LSTM(
return_sequences=False))
model.add(Dropout(config.dropout))
model.add(Dense(
trainY.shape[1]))
model.add(Activation("relu"))
model.compile(loss='mse', optimizer='adam')
model.fit(trainX, trainY, epochs=50, batch_size=64 ,verbose = 2)
可以看到最后的输出是一个全连接层,也就是最终只能输出一个长度为trainY.shape[1]的数组。
所以trainY最多只能是一个二维的矩阵,三维的trainY并不能运行。
那么我们应该怎么办呢?
把trainY由三维转为二维。当进行预测之后,把预测结果再由二维转为三维。
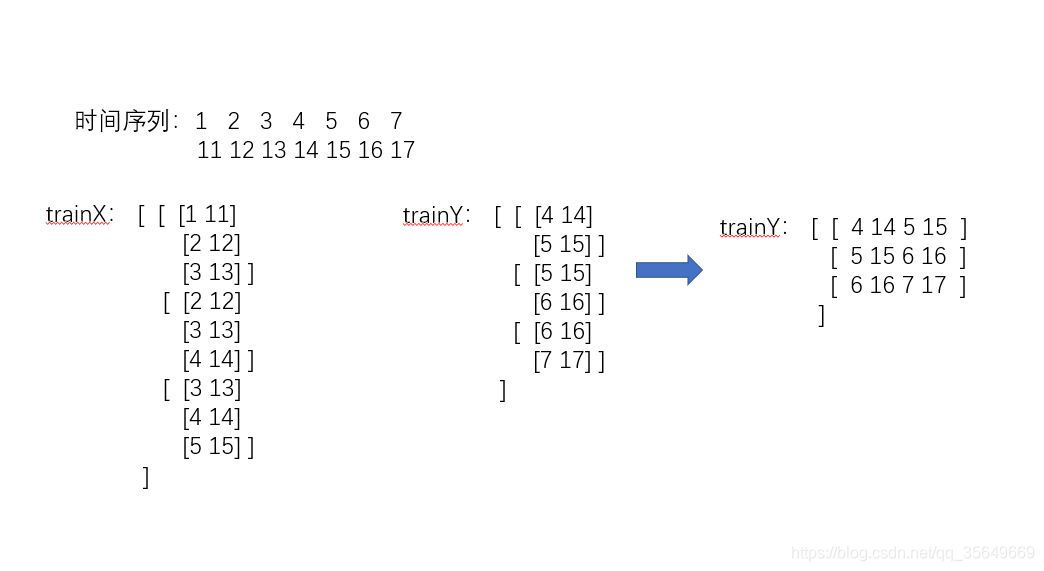
此时的trainX的shape为 (3,3,2) trainY为(3,4) 我们只要记住trainY是如何从三维转化成二维的,再将预测值(二维)按照顺序转化回去即可。
def create_dataset(data,n_predictions,n_next):
对数据进行处理
dim = data.shape[1]
train_X, train_Y = [], []
for i in range(data.shape[0]-n_predictions-n_next-1):
a = data[i:(i+n_predictions),:]
train_X.append(a)
tempb = data[(i+n_predictions):(i+n_predictions+n_next),:]
b = []
for j in range(len(tempb)):
for k in range(dim):
b.append(tempb[j,k])
train_Y.append(b)
train_X = np.array(train_X,dtype='float64')
train_Y = np.array(train_Y,dtype='float64')
return train_X, train_Y
模型训练函数
def trainModel(train_X, train_Y):
trainX,trainY: 训练LSTM模型所需要的数据
model = Sequential()
model.add(LSTM(
140,
input_shape=(train_X.shape[1], train_X.shape[2]),
return_sequences=True))
model.add(Dropout(0.3))
model.add(LSTM(
140,
return_sequences=False))
model.add(Dropout(0.3))
model.add(Dense(
train_Y.shape[1]))
model.add(Activation("relu"))
model.compile(loss='mse', optimizer='adam')
model.fit(train_X, train_Y, epochs=100, batch_size=64, verbose=1)
return model
我们拟定一个二维的数据对其进行实验 这个数据长度是1000条,一维是sin函数 另一维是cos函数
使用前200步去预测后50步
data = np.zeros(2000)
data.dtype = 'float64'
data = data.reshape(1000,2)
sinx=np.arange(0,40*np.pi,2*np.pi/50,dtype='float64')
siny=np.sin(sinx)
cosx=np.arange(0,40*np.pi,2*np.pi/50,dtype='float64')
cosy=np.cos(sinx)
data[:,0] = siny
data[:,1] = cosy
print(data)
plt.plot(data[:,0])
plt.show()
plt.plot(data[:,1])
plt.show()
data,normalize = NormalizeMult(data)
train_X,train_Y = create_dataset(data,200,50)
model = trainModel(train_X,train_Y)
np.save("./MultiSteup2.npy",normalize)
model.save("./MultiSteup2.h5")
注:这里加入了归一化,因为如果不进行归一化的话会导致loss降不下去
当训练完成后 我们使用一个shape为(1,200,2)的test_X去预测得到的y_hat是一个(1,100)的矩阵
所以我们还需要将y_hat转化为(50,2)的矩阵
转化函数为:
def reshape_y_hat(y_hat,dim):
re_y = []
i = 0
while i < len(y_hat):
tmp = []
for j in range(dim):
tmp.append(y_hat[i+j])
i = i + dim
re_y.append(tmp)
re_y = np.array(re_y,dtype='float64')
return re_y
data = np.zeros(400)
data.dtype = 'float64'
data = data.reshape(200,2)
sinx=np.arange(0,8*np.pi,2*np.pi/50,dtype='float64')
siny=np.sin(sinx)
cosx=np.arange(0,8*np.pi,2*np.pi/50,dtype='float64')
cosy=np.cos(sinx)
data[:,0] = siny
data[:,1] = cosy
normalize = np.load("./MultiSteup2.npy")
data = NormalizeMultUseData(data, normalize)
model = load_model("./MultiSteup2.h5")
test_X = data.reshape(1,data.shape[0],data.shape[1])
y_hat = model.predict(test_X)
y_hat = y_hat.reshape(y_hat.shape[1])
y_hat = reshape_y_hat(y_hat,2)
y_hat = FNormalizeMult(y_hat, normalize)
print(y_hat.shape)
plt.plot(y_hat[:,0])
plt.show()
plt.plot(y_hat[:,1])
plt.show()
得到的结果为
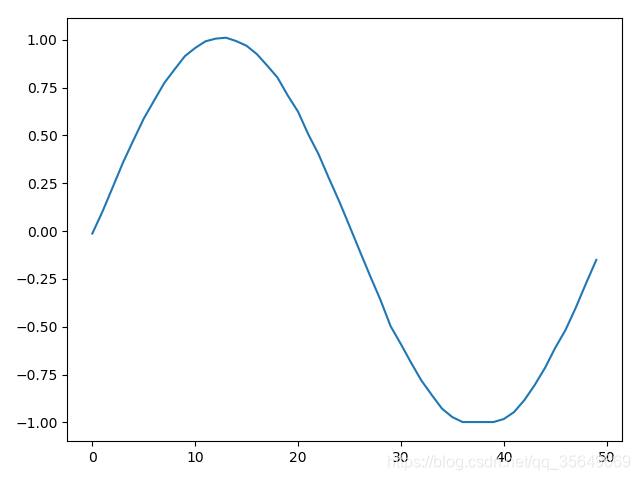
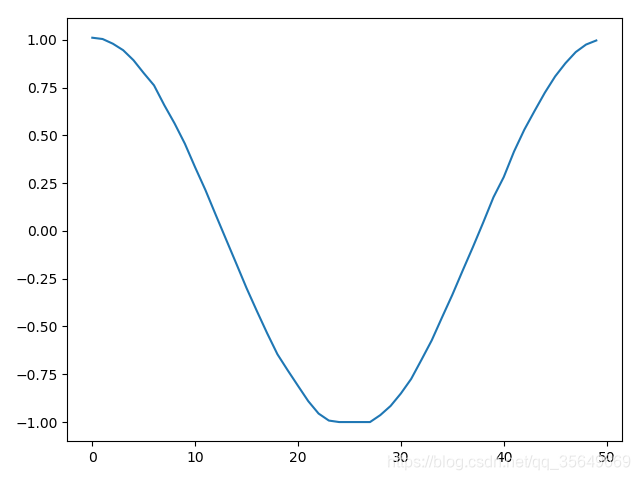
我们知道多维多步还有另一种方法,前者是一步一步去填满这个数组,而现在的方法是一维一维去填满这个数组
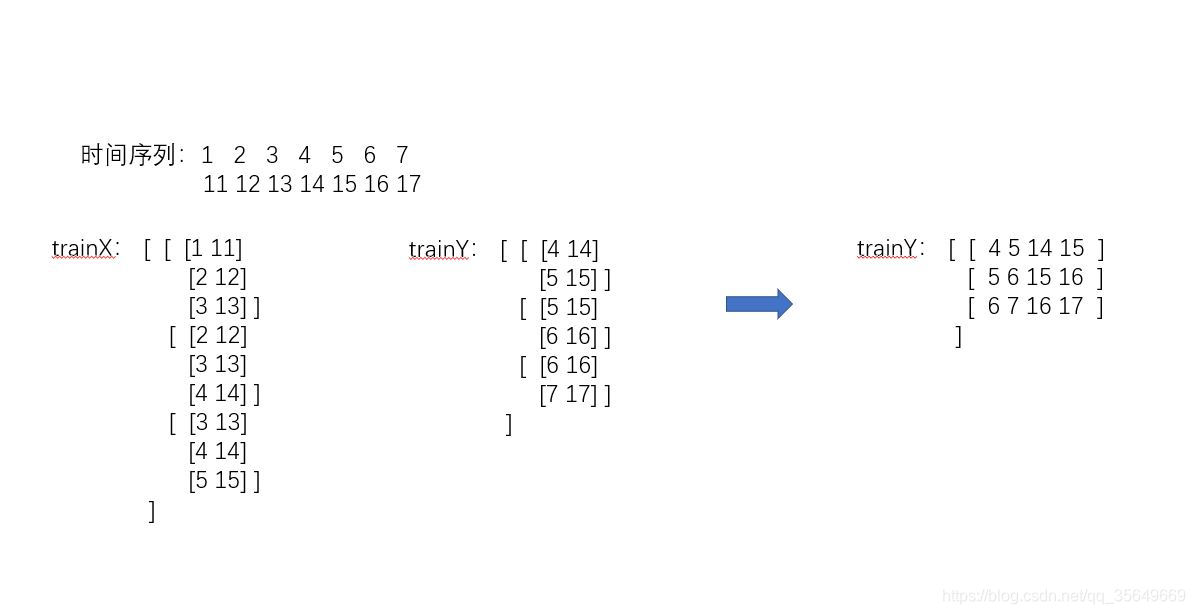
转化函数
def create_dataset(data,n_predictions,n_next):
对数据进行处理
dim = data.shape[1]
train_X, train_Y = [], []
for i in range(data.shape[0]-n_predictions-n_next-1):
a = data[i:(i+n_predictions),:]
train_X.append(a)
tempb = data[(i+n_predictions):(i+n_predictions+n_next),:]
b = []
for j in range(dim):
for k in range(len(tempb)):
b.append(tempb[k,j])
train_Y.append(b)
train_X = np.array(train_X,dtype='float64')
train_Y = np.array(train_Y,dtype='float64')
return train_X, train_Y
反转化函数
def reshape_y_hat(y_hat,dim):
re_y = np.zeros(len(y_hat),dtype='float64')
length =int(len(y_hat)/dim)
re_y = re_y.reshape(length,dim)
for curdim in range(dim):
for i in range(length):
re_y[i,curdim] = y_hat[i + curdim*length]
return re_y
同样的进行刚才的训练,预测结果为:
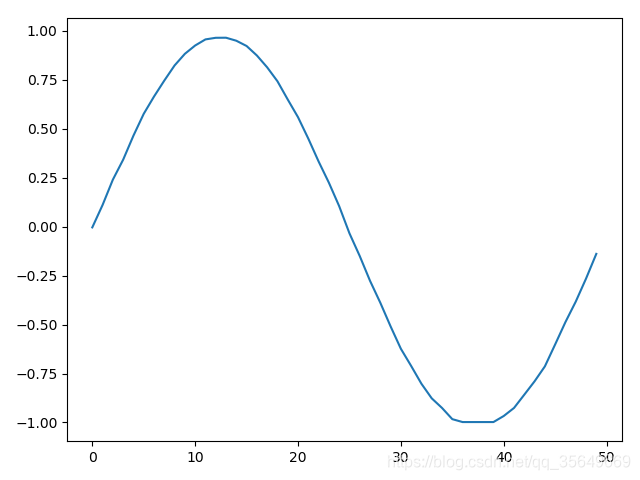
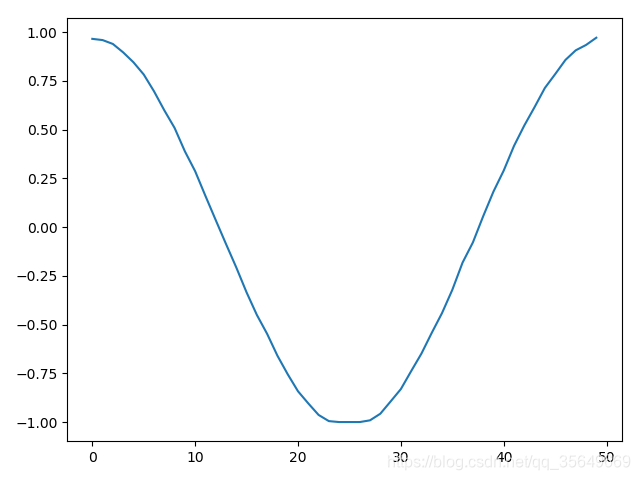
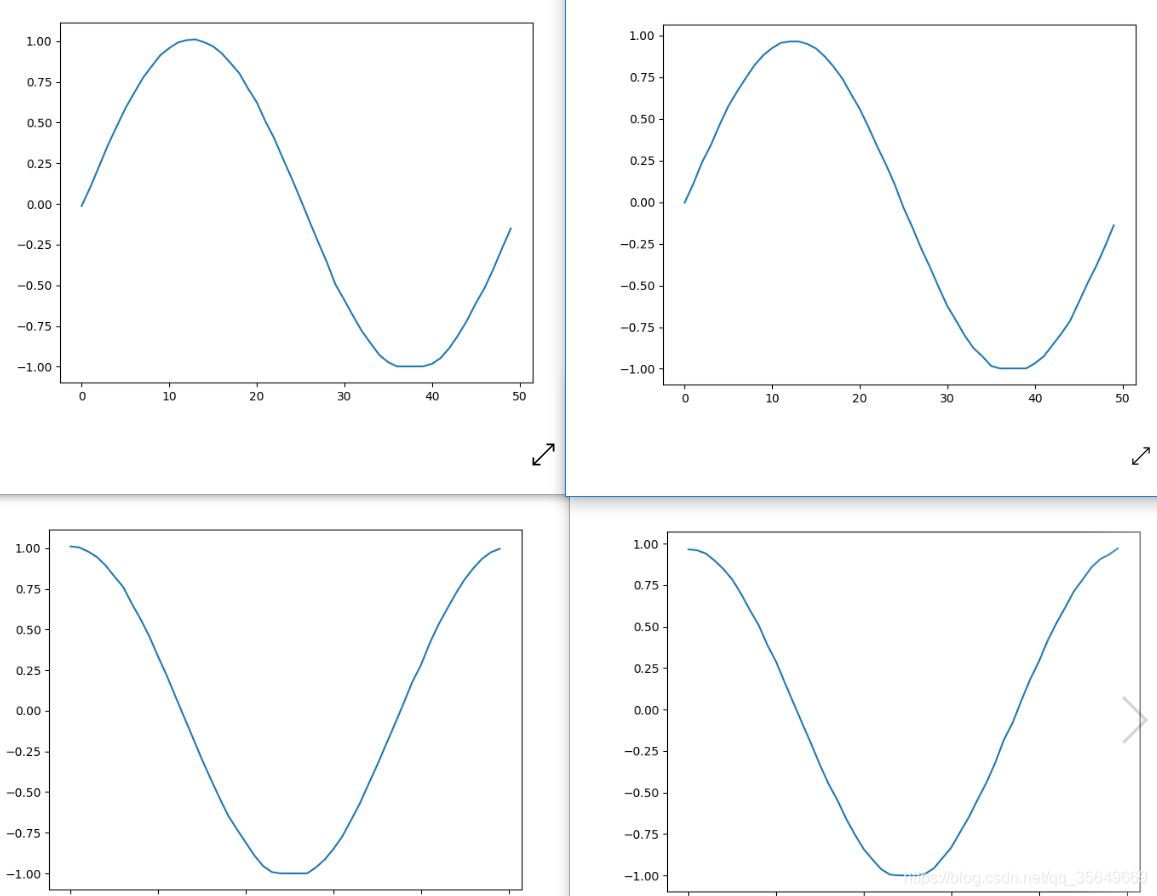
左1右2 由图可见两种方法都是可以适用的,但对于维度很大的精确度还带商榷。
同时训练时建议训练数据的步数至少是1-2个周期,预测步数是训练步数的一半-四分之一乃至更少。
注:代码已上传到我的github
注意🚨🚨🚨:由于是针对于新手小白入门的系列专栏,所以代码并没有采用开发大型项目的方式,而是python单文件实现,这样能够帮助新人一键复制调试运行,不需要理解复杂的项目构造,另外一点就是由于是帮助新人理解时间序列预测基本过程,所以源码仅包含了时间序列预测的基本框架结构,有些地方实现略有简陋,有能力的小伙伴可以根据自己的能力在此基础上进行修改,例如尝试更深层次的模型结构,尝试更多的参数,以及进行分文件编写(模型训练、模型测试、定义模型、绘制图像)达到项目开发流程。,也就是对应第一个输出,第二个模型去训练。
可以看到trainX的shape为 (5,2) trainY为(5,1)
在进行训练的过程中要将trainX reshape为 (5,2,1)(LSTM的输入为 [samples, timesteps, features]
这里的timesteps为步数,features为维度 这里我们的数据是1维的)
2.单维多步(使用前两步预测后两步)
可以看到t...
LSTM因其具有记忆的功能,可以利用很长的序列信息来建立学习模型,所以用它来进行时间序列的预测会很有优势。
在实际工程中用LSTM进行时间序列的预测主要有两个难点:一是前期对数据的处理,二是初始模型的搭建。
原因:回归算法将使用您提供的时间窗口中的值作为样本,以最大程度地减少误差。假设您正在尝试预测时间t的值。输入是以前的收盘价,即t-20到t-1的最后20个输入的时间序列窗口(假设样本输入的timestamp是20)。回归算法可能会学习在时间t-1或t-2处的值作为预测值,因为这样不需要做什么就可以达到优化的误差之类了。这样想:如果在t-1值6..
本专栏整理了《深度学习时间序列预测案例》,内包含了各种不同的基于深度学习模型的时间序列预测方法,例如LSTM、GRU、CNN(一维卷积、二维卷积)、LSTM-CNN、BiLSTM、Self-Attention、LSTM-Attention、Transformer等经典模型,包含项目原理以及源码,每一个项目实例都附带有完整的代码+数据集。
本文的目的是提供代码示例,并解释使用python和TensorFlow建模时间序列数据的思路。
本文展示了如何进行多步预测并在模型中使用多个特征。
本文的简单版本是,使用过去48小时的数据和对未来1小时的预测(一步),我获得了温度误差的平均绝对误差0.48(中值0.34)度。
利用过去168小时的数据并提前24小时进行预测,平均绝对误差为摄氏温度1.69度(中值1.27)。
所使用的特征是过去每小时的温度数据、每日及每年的循环信号、气压及风速。
使用来自https://openweathermap.org/


