


【S01E10】pandas之时间序列

I. 时间序列基础
II. 生成DatetimeIndex
i) date_range函数
pd.date_range('2018/12/1',periods=31)
ii) 读取csv/excel时指定index_col、parse_dates关键字
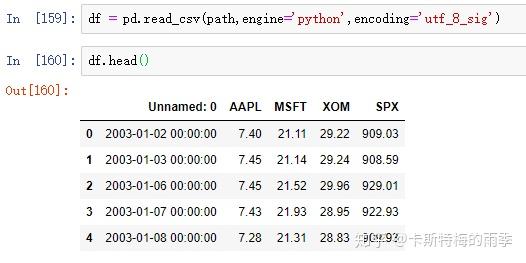
df = pd.read_csv(path, engine='python', encoding='utf_8_sig',
index_col=0, parse_dates=True)
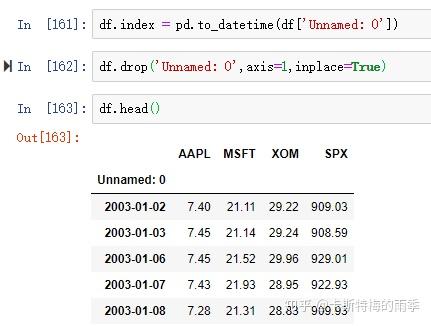
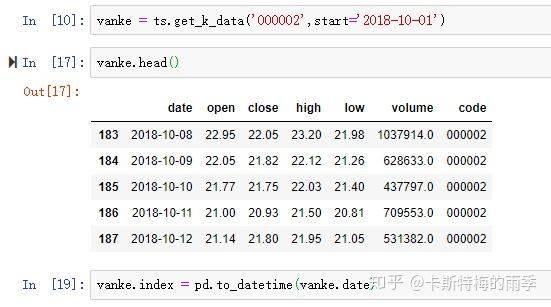
iii)df.index = pd.to_datetime(df['col'])
df.index = pd.to_datetime(df['Unnamed: 0'])
iv)pd.DatetimeIndex
pd.DatetimeIndex(['2018/4/14','2019/4/14'])
III. 索引为DatetimeIndex的pandas对象的索引和切片
索引为DatetimeIndex的Series的索引和切片
i) 索引
ii)切片
索引为DatetimeIndex的DataFrame的索引和切片
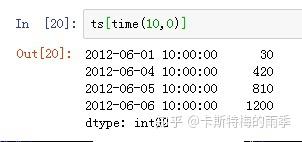
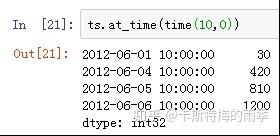
i) 索引 ps. 获取每天特定时间的数据: s[time(10,0)]
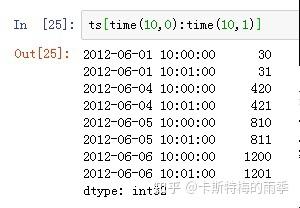
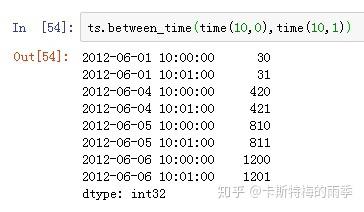
ii)切片 ps. 获取每天特定时间段的数据: s[time(10,0):time(10,1)]
VII. 将DatetimeIndex转换为PeriodIndex及其反向过程
i) 将DatetimeIndex转换为PeriodIndex————to_period
ii)将PeriodIndex转换为DatetimeIndex————to_timestamp
VIII. 重采样(resampling)
DatetimeIndex Resamping
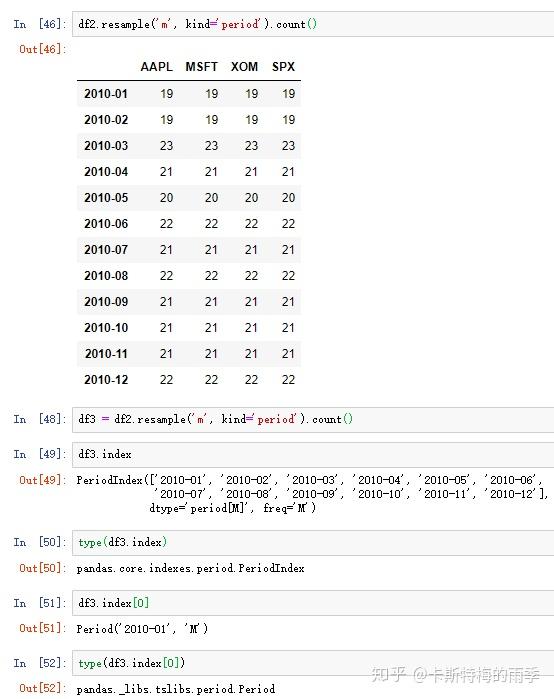
i) 降采样
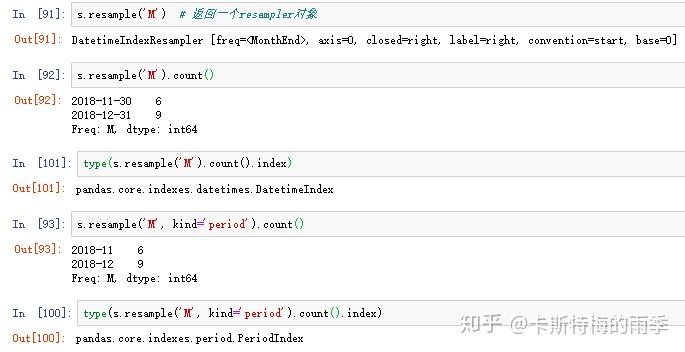
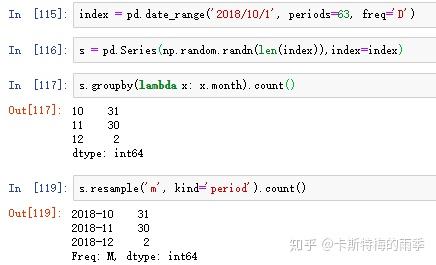
s.resample('m').count()
s.resample('m',kind='period').count()
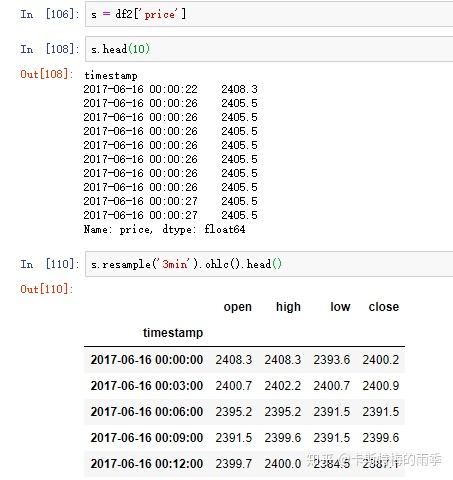
s.resample('3min').ohlc()
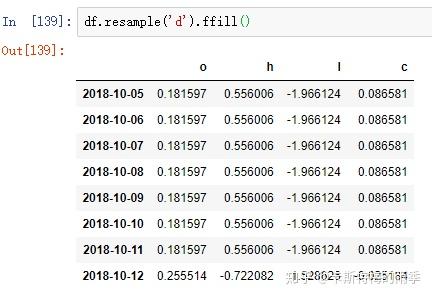
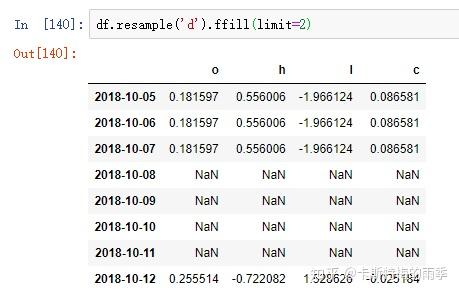
ii)升采样和插值
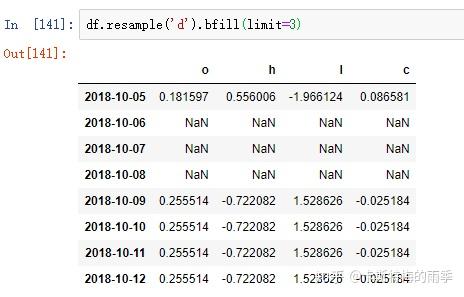
df.resample('d').ffill(limit=2)
PeriodIndex Resamping
i) 降采样
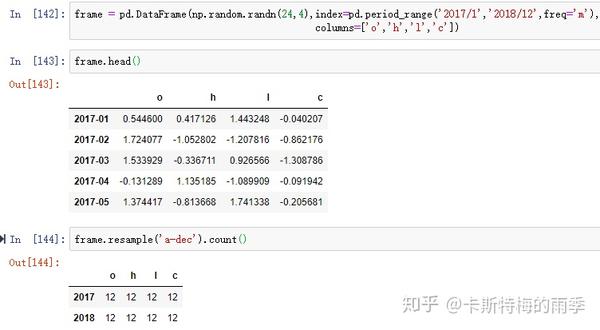
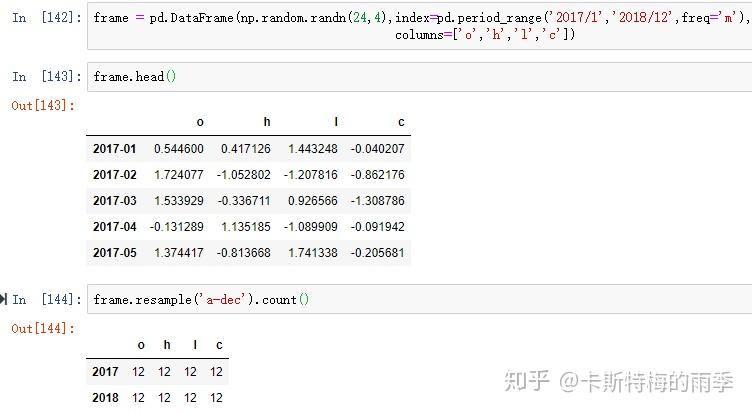
frame.resample('a-dec').count()
ii)升采样和插值
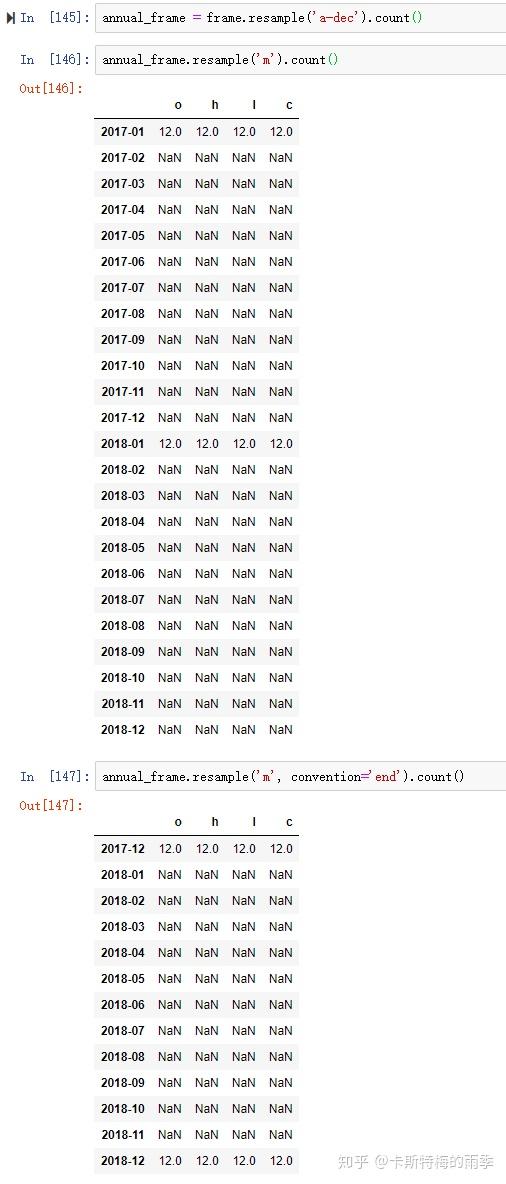
annual_frame.resample('m', convention='end').count()
IX. 移动窗口函数(moving window function)
i) window为整数
ii)window为日期偏移量
X. 频率和时间、日期的偏移
i) 显式创建pd.tseries.offsets对象
from pandas.tseries.offsets import Hour, Minute
ii) 使用字符串别名
pd.date_range('2018/12/25', '2018/12/26',freq='4h30min' )
iii)时间、日期的偏移
s = '2018-12-08 00:08'
d = parse(s) + Minute(2)
df.loc[d]
XI. 移动数据————shift、rollforward、rollback
i) 索引保持不动,将数据前移或后移————shift
df.tip_pct = df.tip_pct.shift(1)
ii) 数据保持不动,将时间戳前移或后移————shift
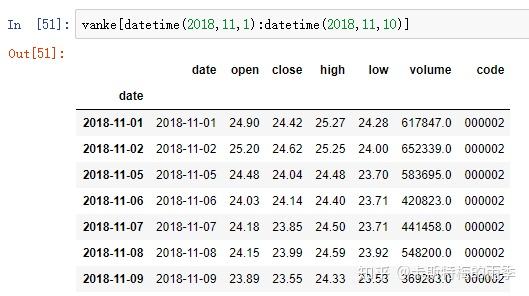
s.shift(2, freq='M')
iii)通过锚点偏移量对日期进行位移
datetime(2018,3,5) + MonthEnd(2)
MonthEnd().rollforward(datetime(2018,3,5))
df.groupby(MonthEnd().rollforward).count()
时间序列(time series)指的是分布在不同时间戳(timestamp)/时期(period)上的值形成的数据集。它可以是按特定频率均匀分隔的,也可以是非均匀分隔的。
I. 时间序列基础
pandas中时间序列的索引分两种,即DatetimeIndex和PeriodIndex,其中最常见的是第一种。
DatetimeIndex
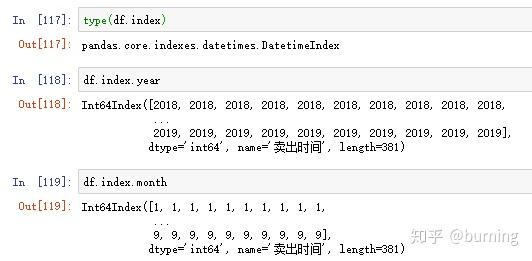
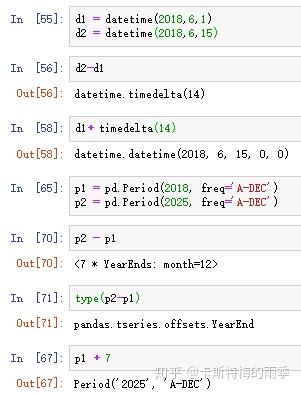
DatetimeIndex是由一个个Timestamp(时间戳)组成的,而Timestamp对象可以根据需要自动转化为datetime对象,所以我们可以把DatetimeIndex看作一个每个索引值都是datetime对象的索引
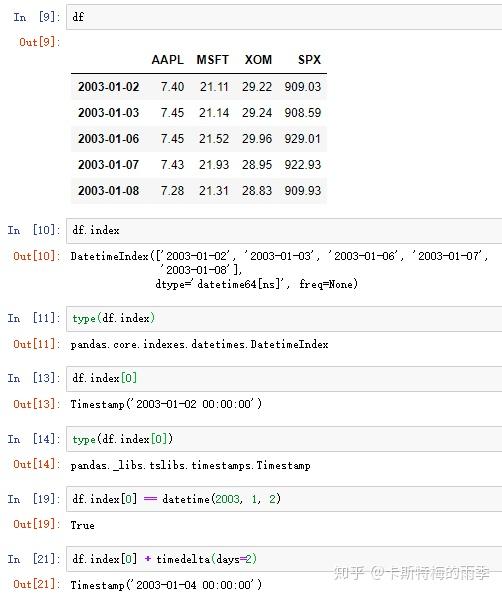

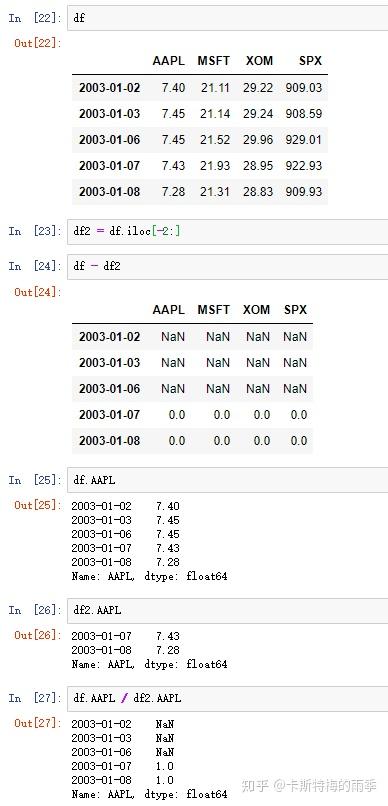
和普通的index一样,不同DatetimeIndex的Pandas对象的算术运算会自动按索引对齐
和普通索引不一样的是,DatetimeIndex还有一些独有的方法和属性
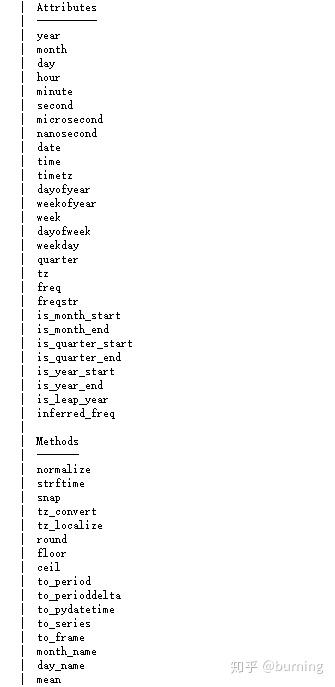
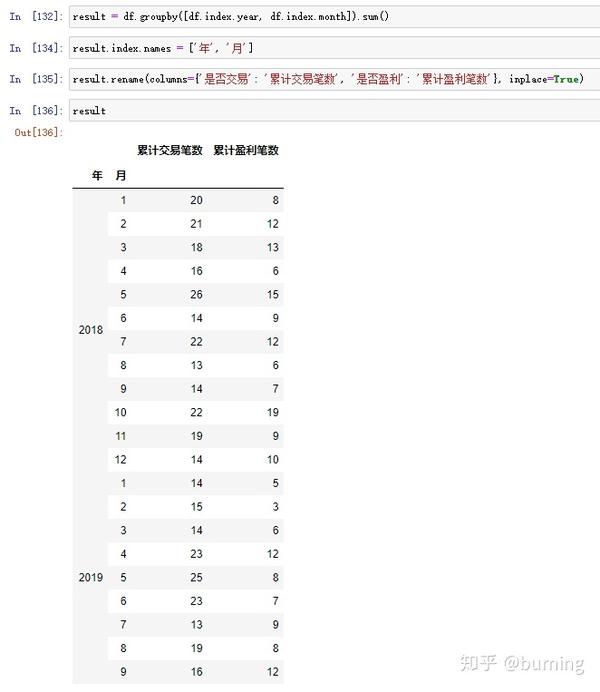
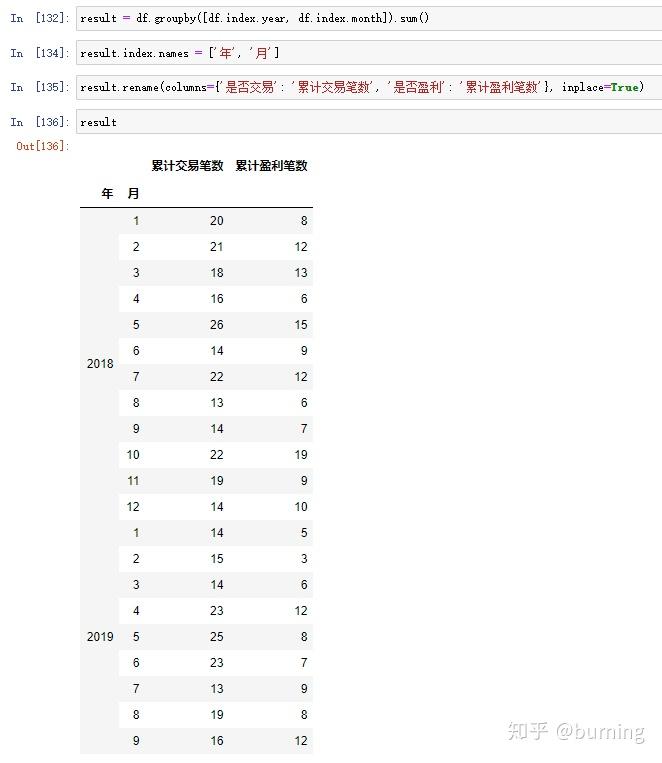
这些方法和属性有时候很有用,举个例子,假设我打算求下面这个DataFrame按年、月分组求和的累计交易笔数和累计盈利笔数就可以利用DatetimeIndex的year和month属性
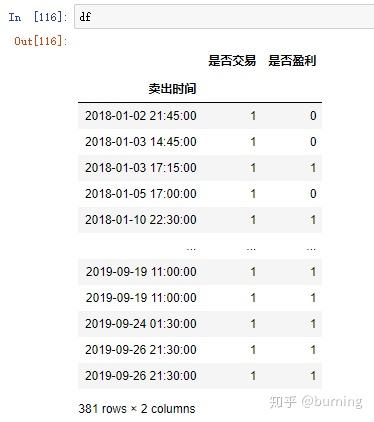

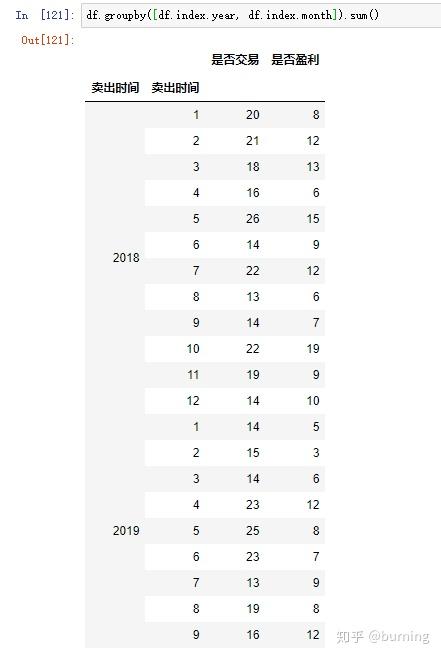

再修改下列名和索引名就可以用了
PeriodIndex
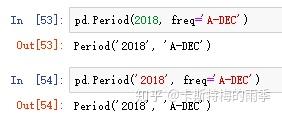
Period对象表示的是一个时间间隔,如年、月、日、时、分,PeriodIndex可以看作是每个索引值都是Period对象的索引

我们可以通过pd.Period()方法主动构造得到Period对象,此时我们需要指定频率(详细的频率及说明见下方的【时间序列基础频率表】)
Period对象还有一些跟Datetime对象类似的特性,对一个Period对象加减一个整数就相当于对其按当前频率进行位移
时间序列基础频率表
别名                 偏移量类型                       说明
D                     Day                             每日历日
B                     BusinessDay                     每工作日
H                     Hour                            每小时
T或min                Minute                          每分钟
S                     Second                          每秒钟
M                     MonthEnd                        每月最后一个日历日
BM                    BusinessMonthEnd                每月最后一个工作日
Q-JAN、Q-FEB          QuarterEnd                      对于以指定月份结束的年度,每季度最后一月的
                                                      最后一个日历日
A-JAN、A-FEB          YearEnd                         每年指定月份的最后一个日历日
II. 生成DatetimeIndex
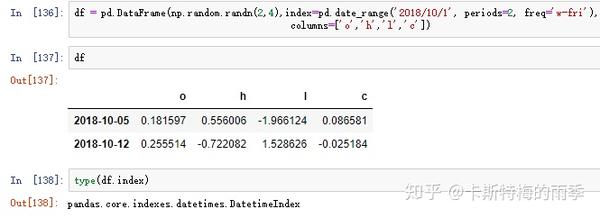
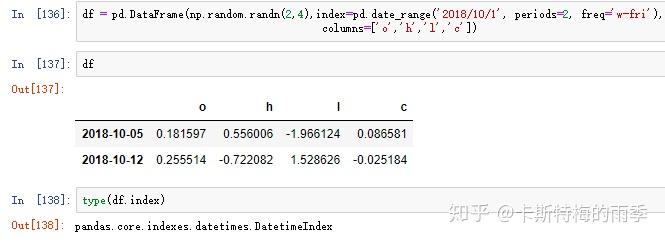
i)pd.date_range()
Return a fixed frequency DatetimeIndex
date_range(start=None, end=None, periods=None, freq=None, tz=None, normalize=False,
name=None, closed=None, **kwargs)
start : str or datetime-like, optional
Left bound for generating dates.
end : str or datetime-like, optional
Right bound for generating dates.
periods : integer, optional
Number of periods to generate.
freq : str or DateOffset, default 'D' (calendar daily)
Frequency strings can have multiples, e.g. '5H'. See
:ref:`here <timeseries.offset_aliases>` for a list of
frequency aliases.
normalize : bool, default False
Normalize start/end dates to midnight before generating date range.
name : str, default None
Name of the resulting DatetimeIndex.
closed : {None, 'left', 'right'}, optional
Make the interval closed with respect to the given frequency to
the 'left', 'right', or both sides (None, the default).
重点参数:
start
periods
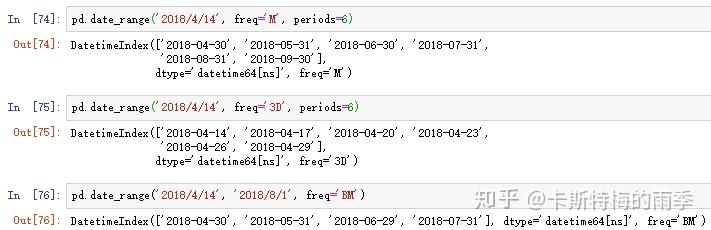
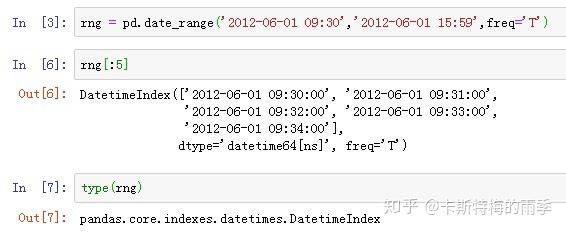
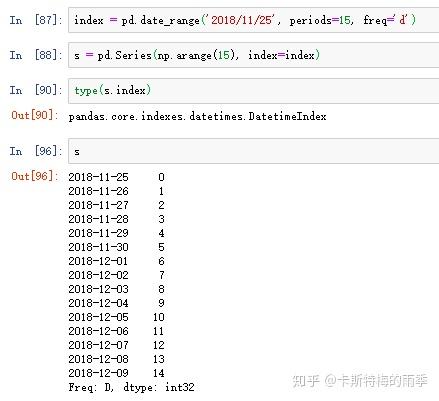
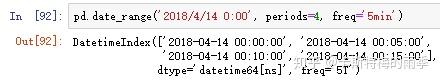
freqpd.date_range()方法可用于生成指定长度和频率的DatetimeIndex:

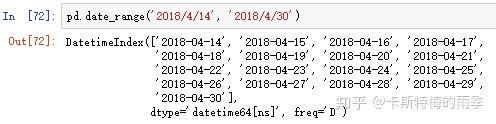
默认频率是'D',也可以传入其他频率;起止时间也可以只传其中一个,但此时需要指定periods,表示长度
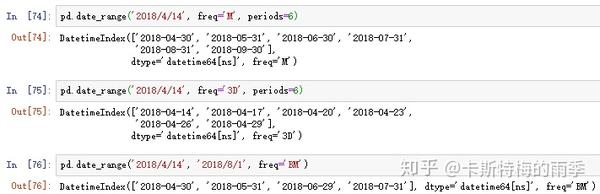
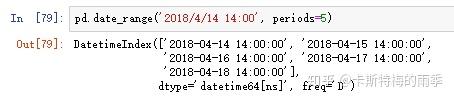
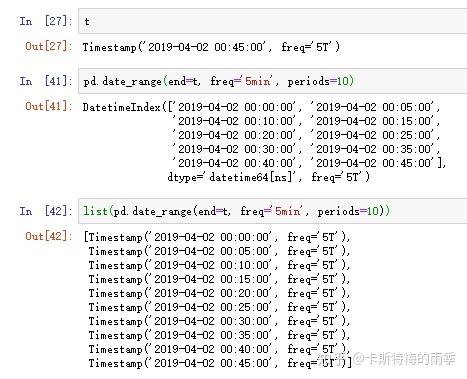
如果timestamp包括具体的时间,date_range()方法默认会保留该时间值:

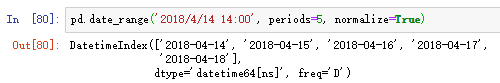
也可以选择传入 normalize=True 把时间部分去掉:

也可以调用list()方法, 将datetimeindex转化为列表:

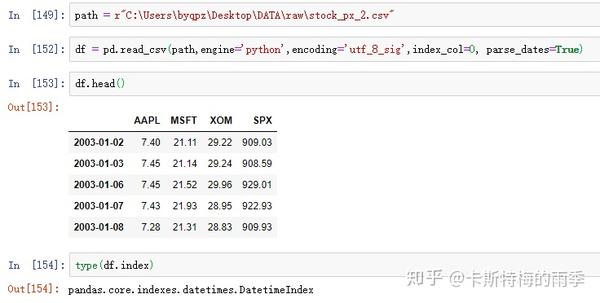
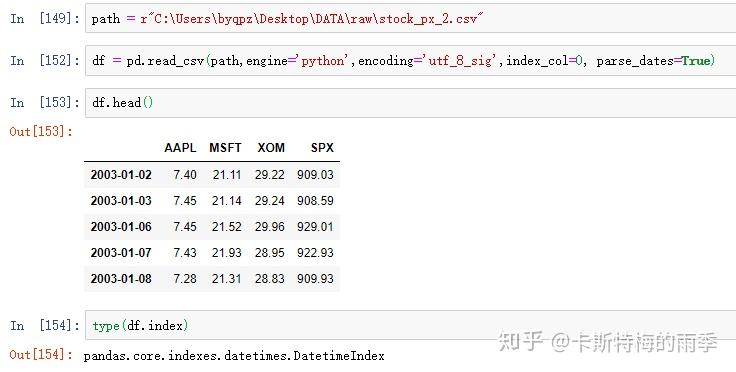
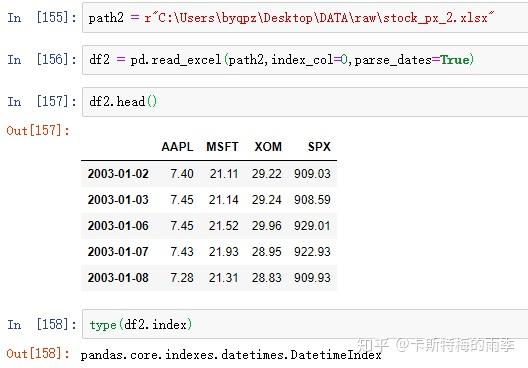
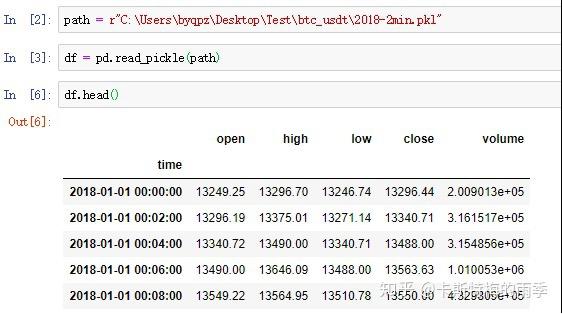
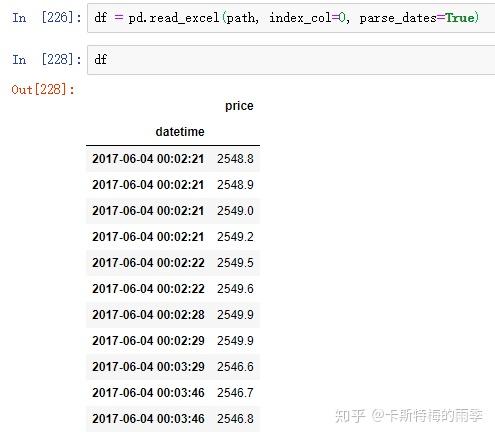
ii)pd.read_csv(path, index_col=n, parse_dates=True)/
pd.read_excel(path, index_col=n, parse_dates=True)
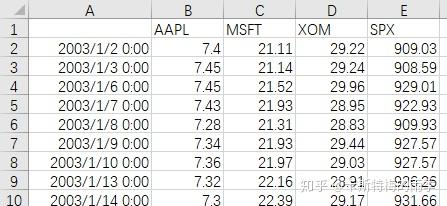
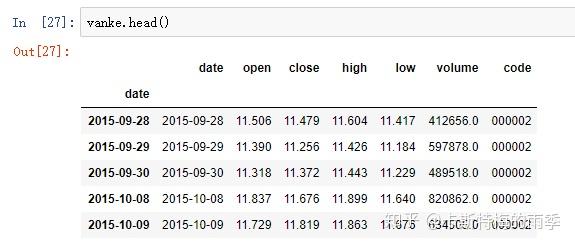
数据如下:

read_csv
read_excel

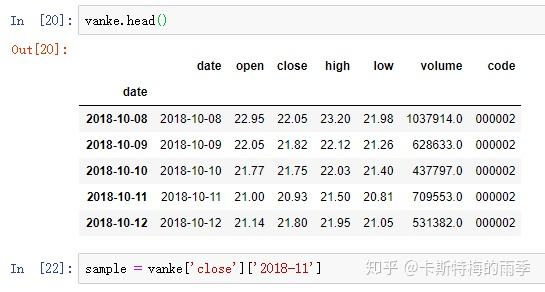
iii)df.index = pd.to_datetime(df['col'])


iv)pd.DatetimeIndex


III. 索引为DatetimeIndex的pandas对象的索引和切片

索引为DatetimeIndex的Series的索引和切片

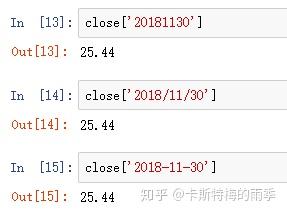
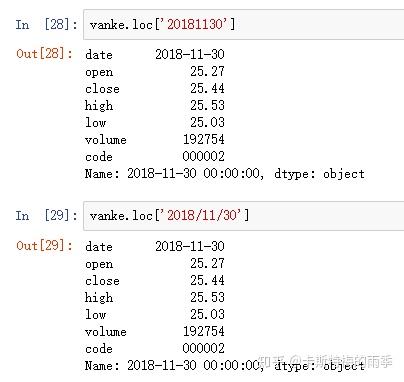
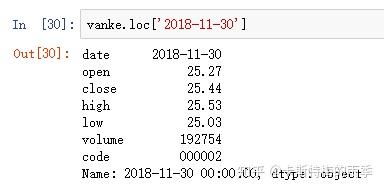
i)索引
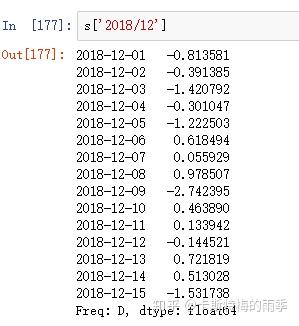
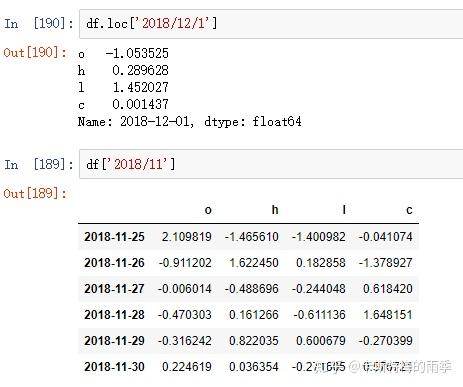
传入一个可以被解释为时期的字符串
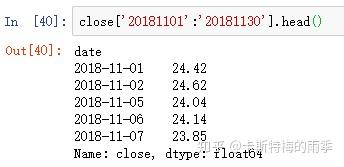
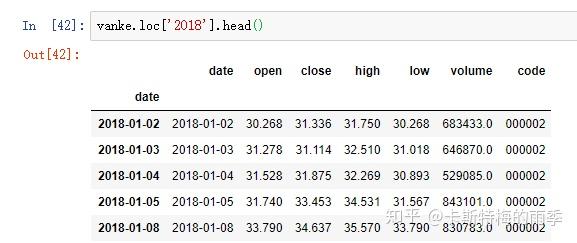
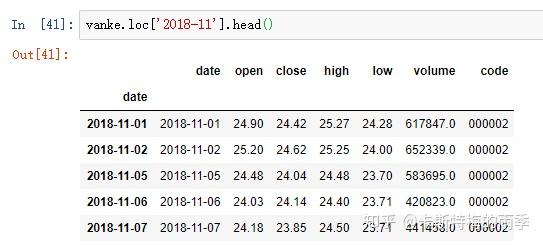
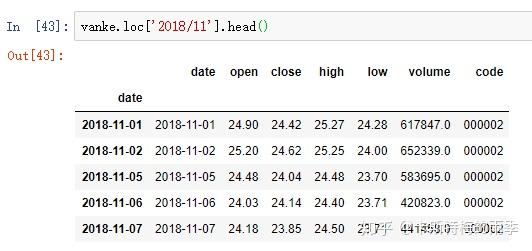
对于较长的时间序列,只需要传入“年”或“年月”即可轻松选取数据的切片:
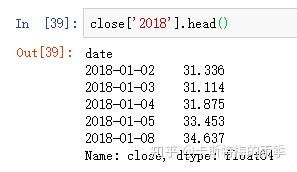

(相当于 close['20181101':'20181130'])
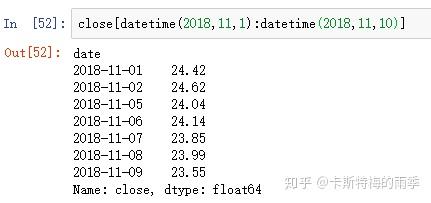
或传入datetime
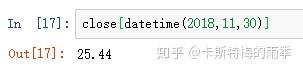

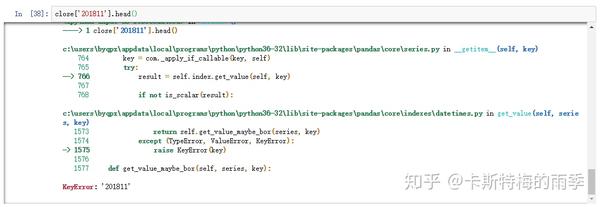
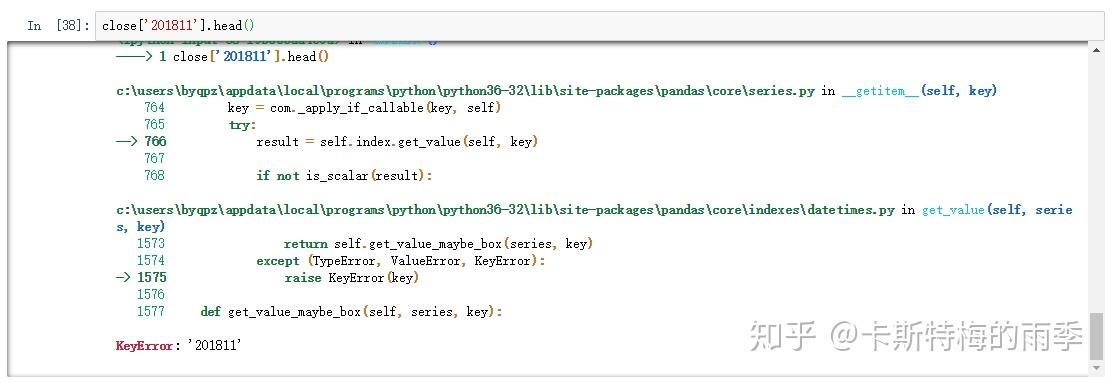
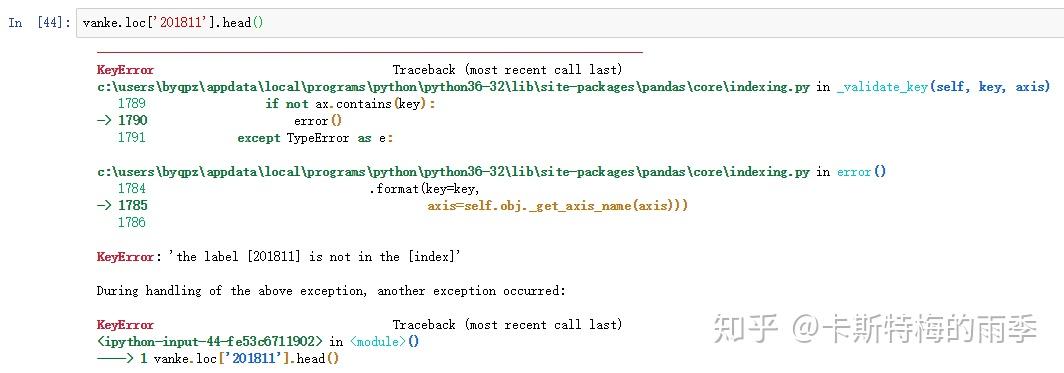
但不能用'201811'这样的形式选取月
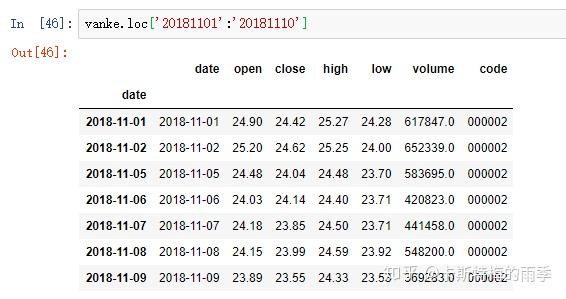
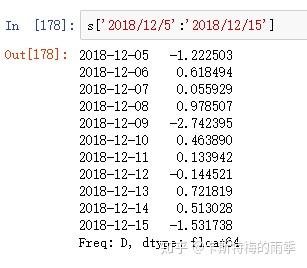
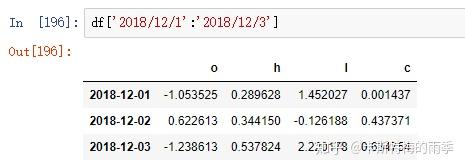
ii)切片
传入字符串日期
传入datetime

索引为DatetimeIndex的DataFrame的索引和切片

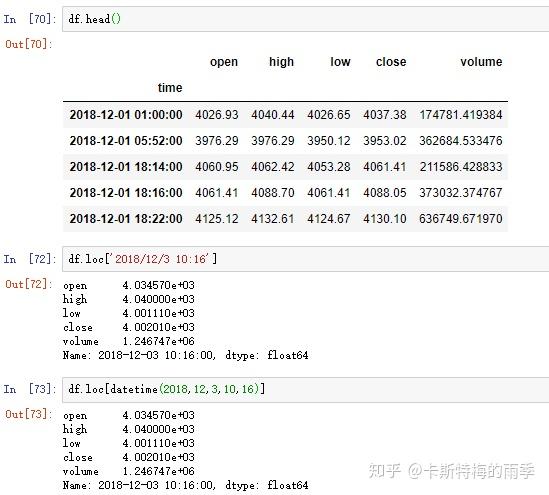
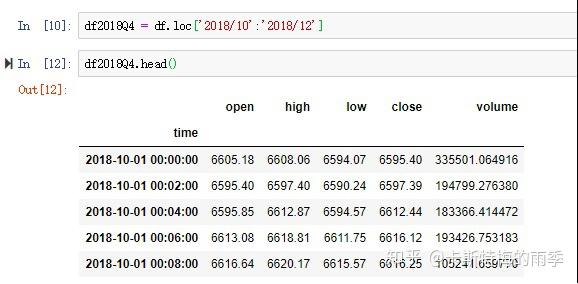
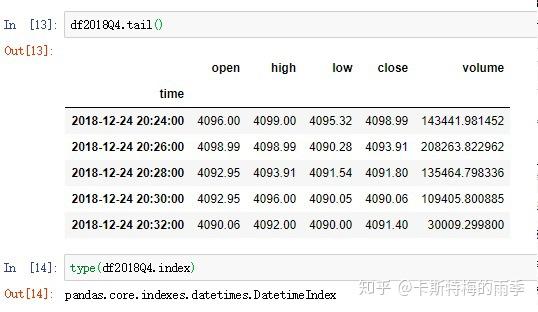
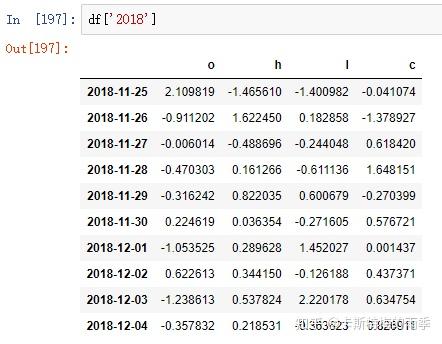
i)索引
选取年月:


ii)切片


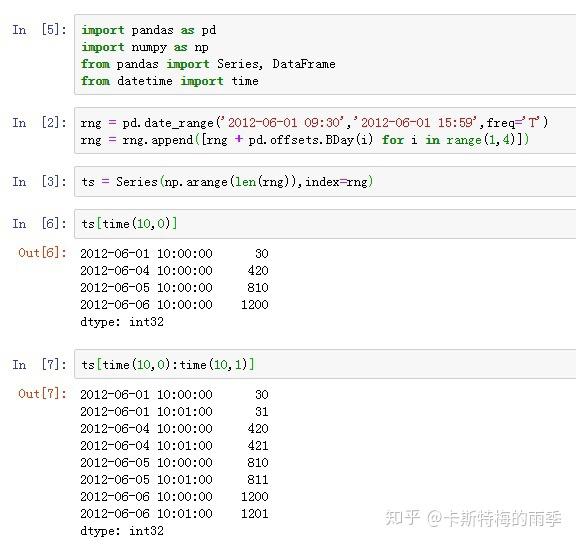
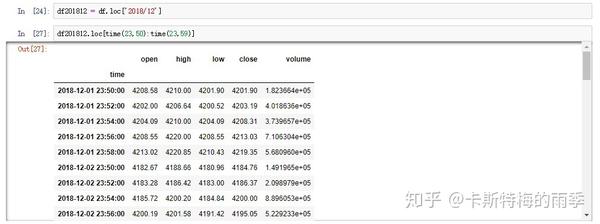
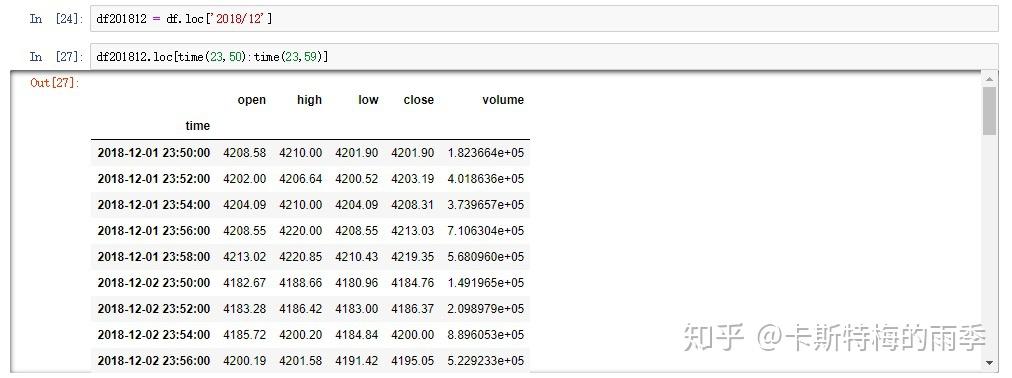
特别一点的切片


那如果我们想获得每天特定时间段的数据该怎么做呢?
且看下面两个例子

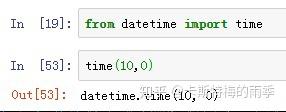
传入time,索引单个时间点,相当于下面的at_time方法
时间段切片,相当于下面的between_time方法
完整的代码如下

另一个例子更贴近实际应用,假如我们发现某交易对在12月份每天接近24:00时交易量和价格都会出现大幅波动。那么我们现在的目标就是选取每天23:50-23:59的k线数据,然后可视化观察一下是否真的存在这个现象
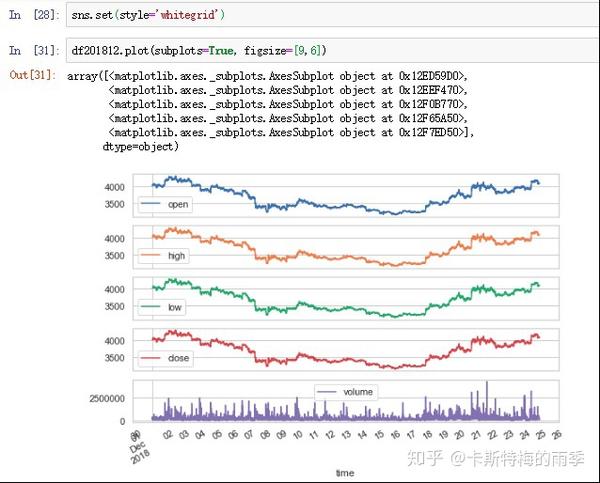
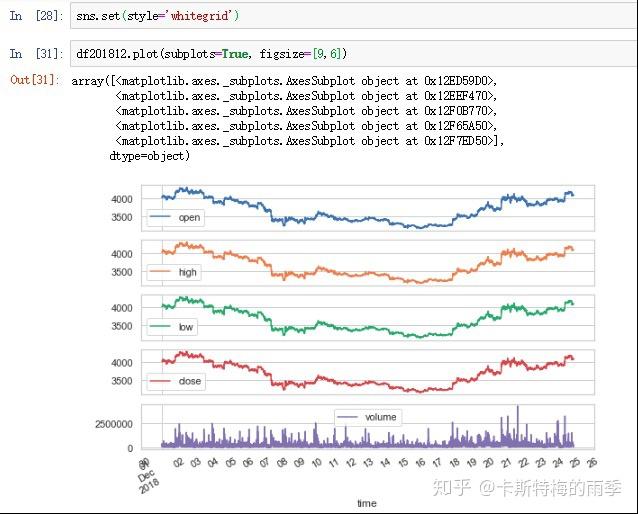
pandas时间序列的索引和切片是一大利器
IV. 生成PeriodIndex
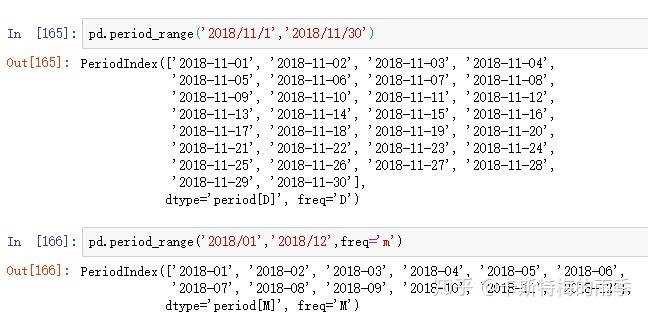
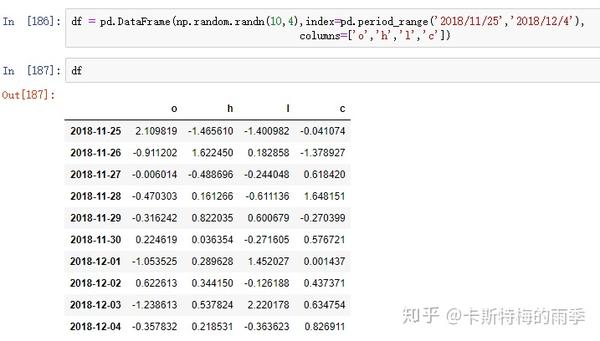
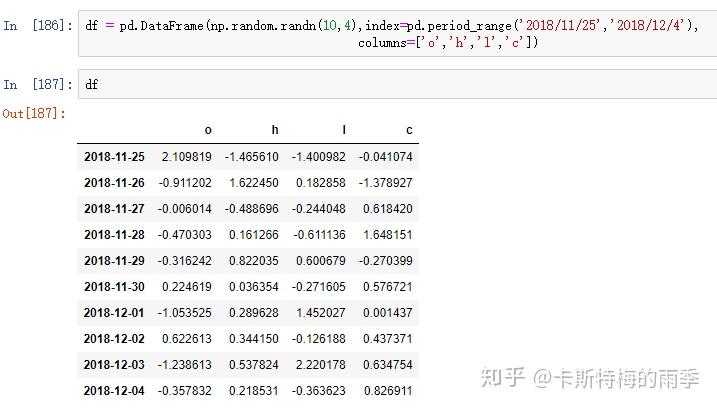
i)pd.period_range
Return a fixed frequency PeriodIndex, with day (calendar) as the default
frequency
period_range(start=None, end=None, periods=None, freq='D', name=None)
start : string or period-like, default None
        Left bound for generating periods
end : string or period-like, default None
        Right bound for generating periods
periods : integer, default None
        Number of periods to generate
freq : string or DateOffset, default 'D' (calendar daily)
        Frequency alias
name : string, default None
        Name of the resulting PeriodIndex
重点参数:
       start
       periods
       freq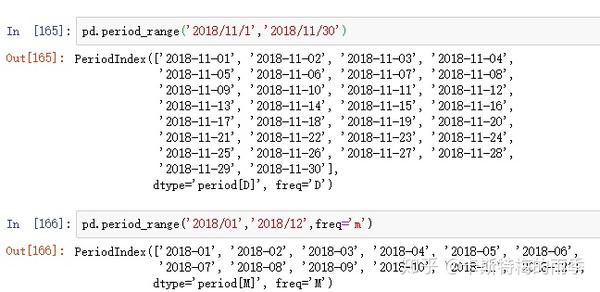
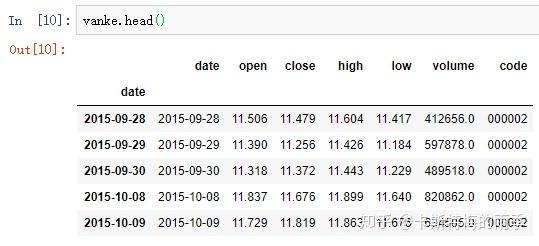
ii)把分开放在不同列中的时间信息合并成一个PeriodIndex
数据:
链接: https:// pan.baidu.com/s/1Pe7Emx t0KPHnsG6SakdF9A
提取码:4dwg
把时间信息分开存放在多列中的数据集适用这种方法

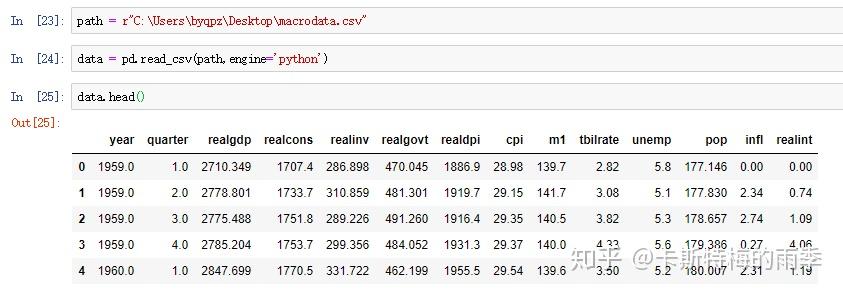

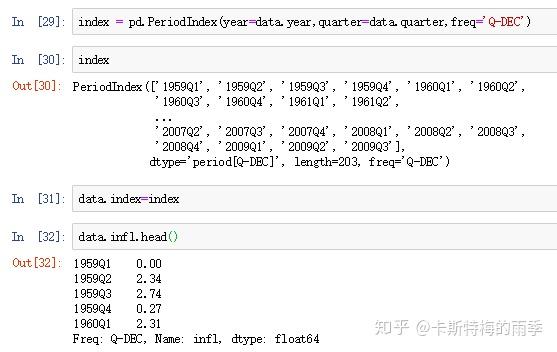
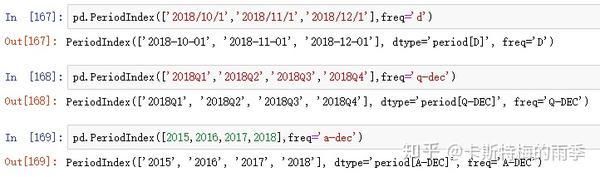
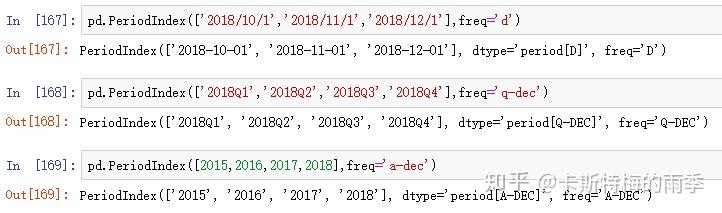
iii)通过pd.PeriodIndex创建
V. 索引为 PeriodIndex 的pandas对象的索引和切片
索引为PeriodIndex的Series的索引和切片

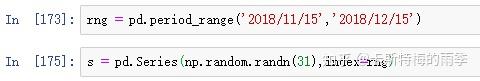
i)索引
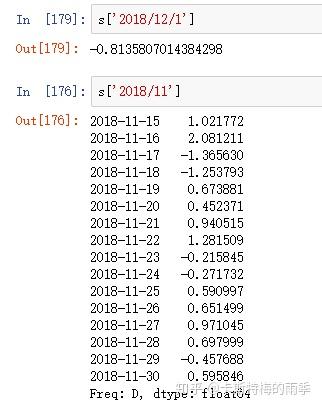
ii)切片
索引为PeriodIndex的DataFrame的索引和切片
i)索引


ii)切片

VI. 时期的频率转换
Period和PeriodIndex对象都可以通过asfreq方法转换成其他频率。
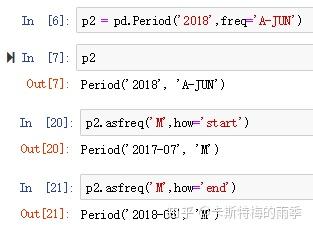
i)Period对象转换成别的频率————asfreq
把低频率转化为高频率需要指定how
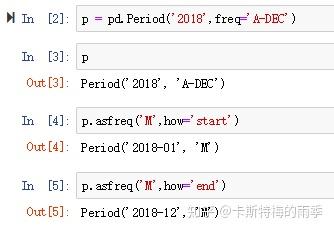
有些年度并不以12月作为一年的结束,比如财年,此时指定how='start'/'end'得到的月份要根据财年的结束月份来看
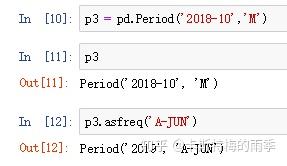
而将高频率转换为低频率时,目标时期(pandas中称superperiod)由初始时期(pandasv中称subperiod)所在的位置决定。
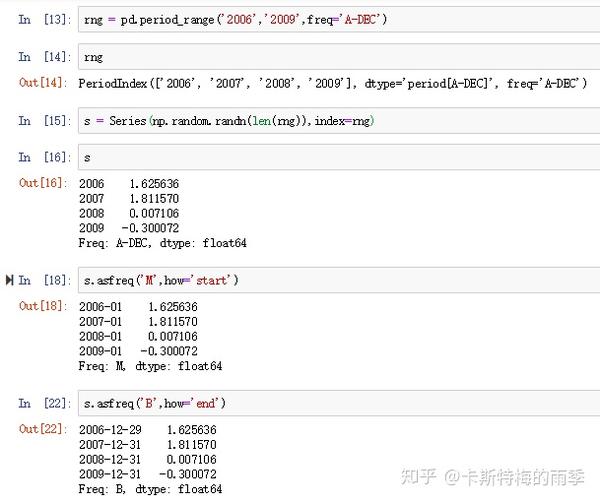
ii)PeriodIndex对象转换成别的频率————asfreq
PeriodIndex的频率转换方式也类似

VII. 将DatetimeIndex转换为PeriodIndex及其反向过程
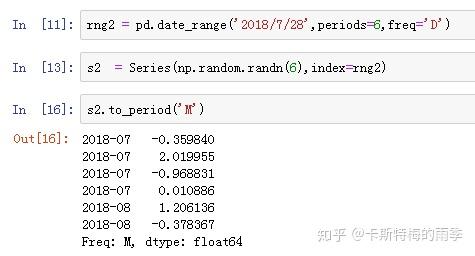
i)将DatetimeIndex转换为PeriodIndex————to_period
通过使用to_period方法,可以将由时间戳索引的Series和DataFrame对象转换为时期索引:
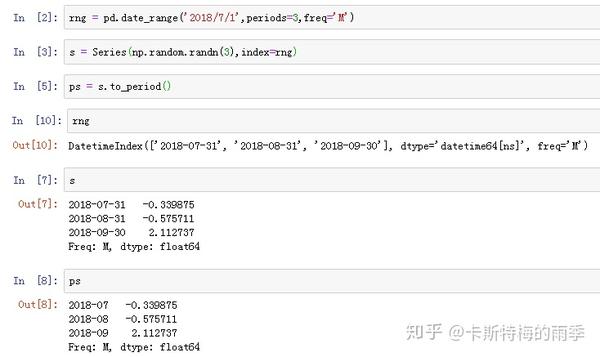

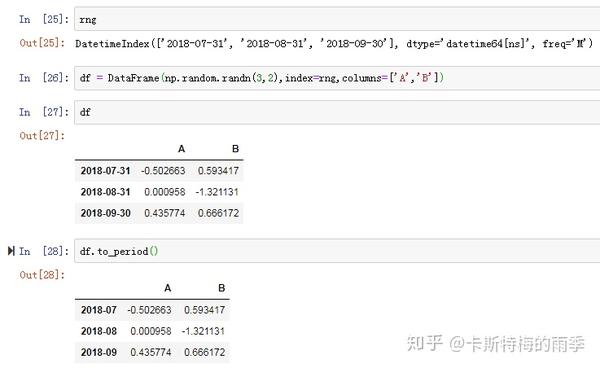
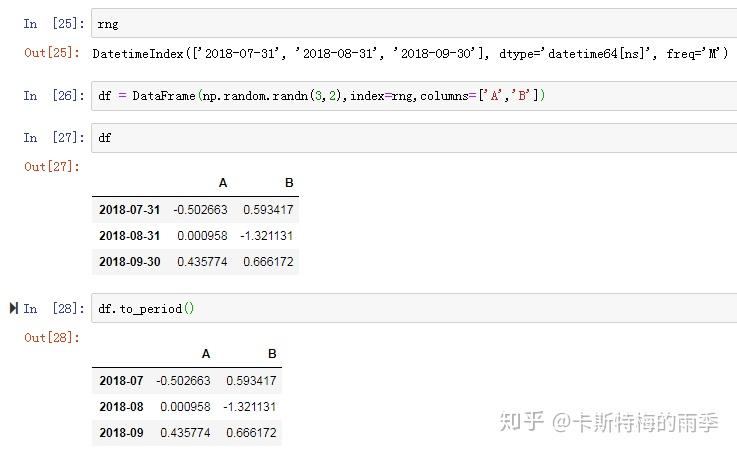
PeriodIndex的频率默认是从DatetimeIndex的频率推断而来的,也可以指定其他频率。

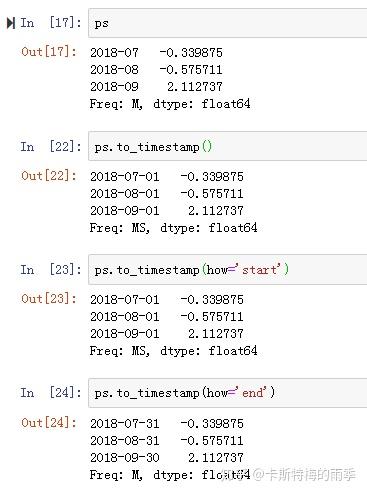
ii)将PeriodIndex转换为DatetimeIndex————to_timestamp
VIII. 重采样(resampling)
(下面这段重采样的定义文字来自 Wes McKinney 《利用Python进行数据分析》)
重采样(resampling)指的是将时间序列从一个频率转换到另一个频率的处理过程。将高频率数据聚合到低频率称为降采样(downsampling),而将低频率数据转换到高频率则称为升采样(upsampling)。 并不是所有的重采样都能被划分到这两个大类中。例如,将W-WED(每周三)转换到W-FRI(每周五)既不是降采样也不是升采样。
Convenience method for frequency conversion and resampling of time
series. Object must have a datetime-like index (DatetimeIndex,
PeriodIndex, or TimedeltaIndex), or pass datetime-like values
to the on or level keyword.
resample(rule, how=None, axis=0, fill_method=None, closed=None, label=None,
convention='start', kind=None, loffset=None, limit=None, base=0,
on=None, level=None)
rule : string
the offset string or object representing target conversion
axis : int, optional, default 0
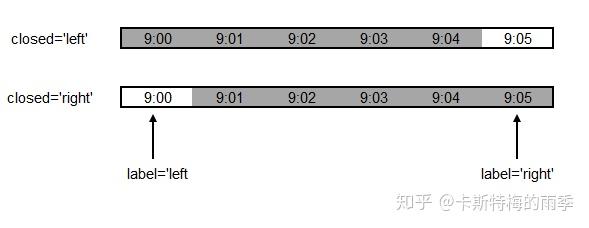
closed : {'right', 'left'}
Which side of bin interval is closed. The default is 'left'
for all frequency offsets except for 'M', 'A', 'Q', 'BM',
'BA', 'BQ', and 'W' which all have a default of 'right'.
label : {'right', 'left'}
Which bin edge label to label bucket with. The default is 'left'
for all frequency offsets except for 'M', 'A', 'Q', 'BM',
'BA', 'BQ', and 'W' which all have a default of 'right'.
convention : {'start', 'end', 's', 'e'}
For PeriodIndex only, controls whether to use the start or end of
当重采样时期时,将低频率转换到高频率所采用的约定('start'或'end'),
默认为'start'
kind: {'timestamp', 'period'}, optional
Pass 'timestamp' to convert the resulting index to a
``DateTimeIndex`` or 'period' to convert it to a ``PeriodIndex``.
By default the input representation is retained.
聚合到时期('Period')或时间戳('timestamp'),默认聚合到时间序列的索引类型
loffset : timedelta
Adjust the resampled time labels
面元标签的时间校正值,比如'-1s'/Second(-1)用于将聚合标签调早1秒
base : int, default 0
For frequencies that evenly subdivide 1 day, the "origin" of the
aggregated intervals. For example, for '5min' frequency, base could
range from 0 through 4. Defaults to 0
on : string, optional
For a DataFrame, column to use instead of index for resampling.
Column must be datetime-like.
level : string or int, optional
For a MultiIndex, level (name or number) to use for
resampling. Level must be datetime-like.
DatetimeIndex Resamping
i)降采样
(下面这段定义文字摘录自 Wes McKinney 《利用Python进行数据分析》)
将数据聚合到规整的低频率是一件非常普通的时间序列处理任务。待聚合的数据不必拥有固定的频率,期望的频率会自动定义聚合的面元边界,这些面元用于将时间序列拆分为多个片段。 各时间段都是半开放的。一个数据点只能属于一个时间段,所有时间段的并集必须能组成整个时间帧
example 1:


example 2:
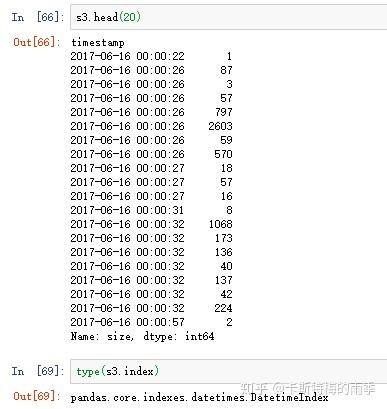
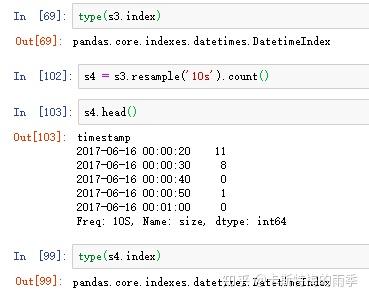
"1分钟"数据被转换为"5分钟"数据的处理过程:

除了可以对resampler对象调用mean、count、sum、min、max、median、first、last等函数外,还可以对其调用ohlc,即计算各面元的四个值:open(开盘价)、high(最高价)、low(最低价)、close(收盘价)。对resampler对象调用 .ohlc() 即可得到含有这四种聚合值的DataFrame

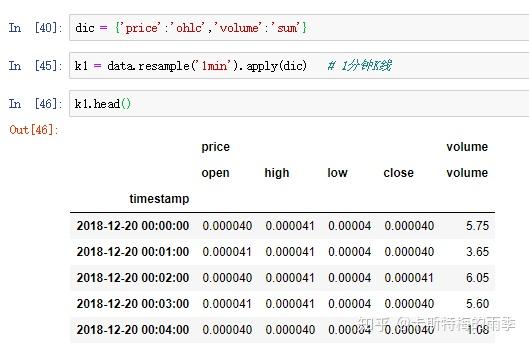
更自由的函数定义方式是我们之前提到过的 apply方法, 对其传入"列名:函数名"键值对的字典,我们就可以对不同的列定义不同的聚合函数。下面结合K线图的生成及转化简单介绍一下:
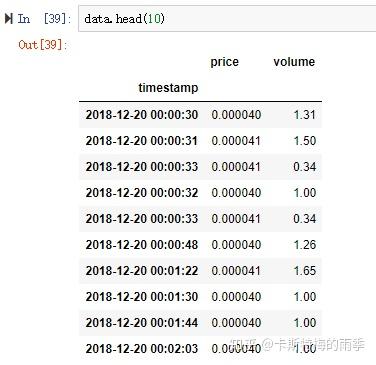
原始数据like this,字段分别为时间,交易类型,量,价格
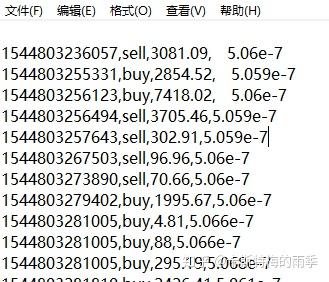
先简单处理一下

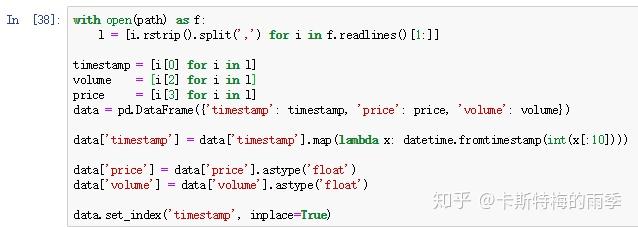
处理后的数据如下所示
接下来降采样,用apply(dict)的方式生成一分钟K线,注意看

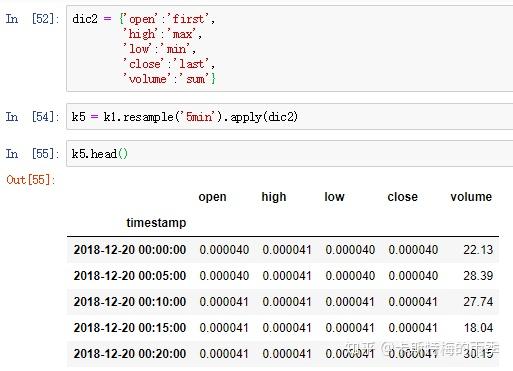
然后是K线转化,但因为我们前面得到是一个MultiIndex的df,所以需要先处理一下columns

接下来是类似的操作

除了resample()方法,还可以使用groupby()方法对数据进行降采样。如果需要根据月份进行分组,只需传入一个能够访问时间序列的索引上的这些字段的函数即可:

因为重采样中降采样出现的频率会更高,所以这里介绍得更详细一些。
ii)升采样和插值
如果是将数据从低频转换到高频,就无需聚合。
升采样默认会引入缺失值,如果想用前后数据填充缺失,调用ffill,bfill等方法即可(resampling的填充和插值方式跟fillna和reindex的一样),也可以在其中传入limit参数,限制填充的距离


PeriodIndex Resamping
i)降采样
对索引是PeriodIndex的数据进行降采样
ii)升采样和插值
convention默认为'start',也可以手动设置为'end'

IX. 移动窗口函数(moving window function)
Provides rolling window calculations.
rolling(window, min_periods=None, center=False, win_type=None, on=None, axis=0, closed=None)
window : int, or offset
         Size of the moving window. This is the number of observations used for
         calculating the statistic. Each window will be a fixed size.
         If its an offset then this will be the time period of each window. Each
         window will be a variable sized based on the observations included in
         the time-period. This is only valid for datetimelike indexes. This is
         new in 0.19.0
min_periods : int, default None
         Minimum number of observations in window required to have a value
         (otherwise result is NA). For a window that is specified by an offset,
         this will default to 1.
center : boolean, default False
         Set the labels at the center of the window.
win_type : string, default None
         Provide a window type. If ``None``, all points are evenly weighted.
         See the notes below for further information.
on : string, optional
         For a DataFrame, column on which to calculate
         the rolling window, rather than the index
closed : string, default None
         Make the interval closed on the 'right', 'left', 'both' or
         'neither' endpoints.
         For offset-based windows, it defaults to 'right'.
         For fixed windows, defaults to 'both'. Remaining cases not implemented
         for fixed windows.

i)window为整数
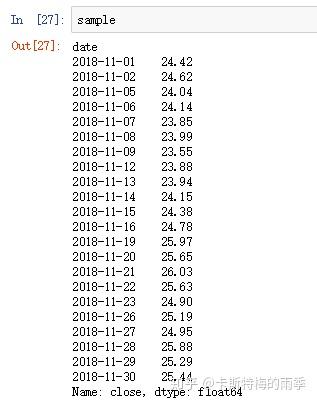
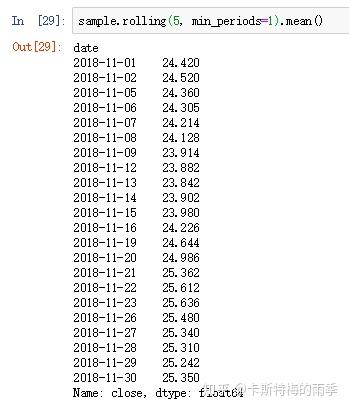
如果只传入一个表示移动窗口大小的整数(这里是5),sample.rolling(5).mean()计算的就是11月连续5天收盘价的算数平均值,此时min_periods默认是None
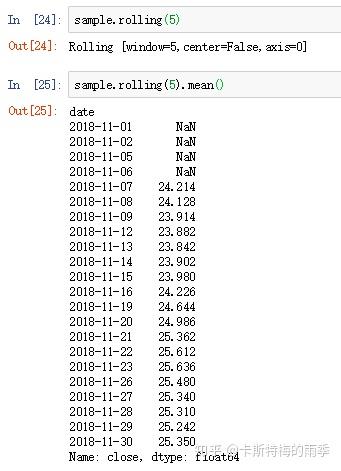
当然,我们可以手动设置min_periods,如果min_periods=1,前面11-1、11-2、11-5、11-6对应的值就不会为空了,它们分别会变成24.42、(24.42 + 24.62)/2、(24.42 + 24.62 + 24.04)/3、(24.42 + 24.62 + 24.04 + 24.14)/4。换言之,在window是一个整数的情况下,如果观测值的数量不足移动窗口的大小,且设置了min_periods,则从长度满足min_periods的位置开始计算统计量。
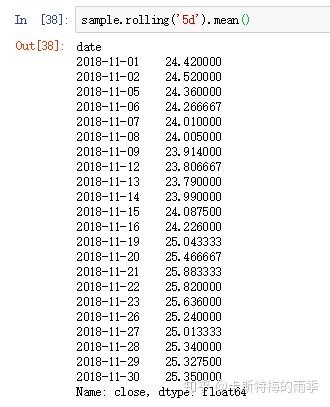
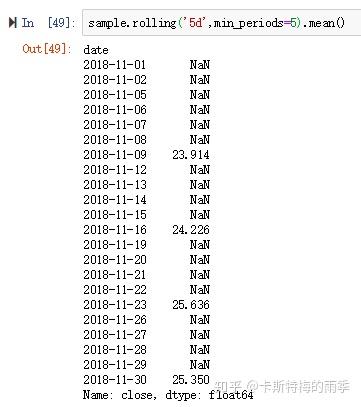
ii)window为日期偏移量
而如果向window传入的是日期偏移量,且索引为DatetimeIndex,那么每个移动窗口的大小就是对应的偏移量的大小。当window是一个日期偏移量的时候,min_periods默认为1。此时11-5、11-6、11-7对应的分别就是(24.42+24.62+24.04)/3、(24.62+24.04+24.14)/3、(24.04+24.14+23.85)/3,因为对应的是日历日嘛。那能不能传入工作日呢?不行,因为BusinessDays并不是一个固定的频率
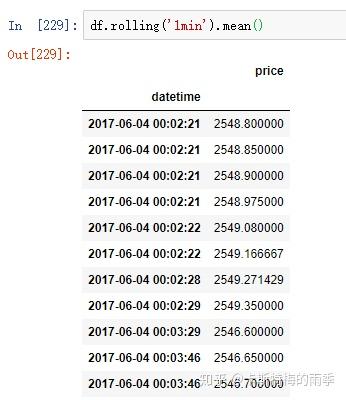
特别需要注意的是,当window为偏移量的时候,closed默认为右侧关闭。例如下面这个demo, 00:03:29 对应移动窗口是 00:02:30 至 00:03:29 ,,所以不计算 00:02:29 的价格在内

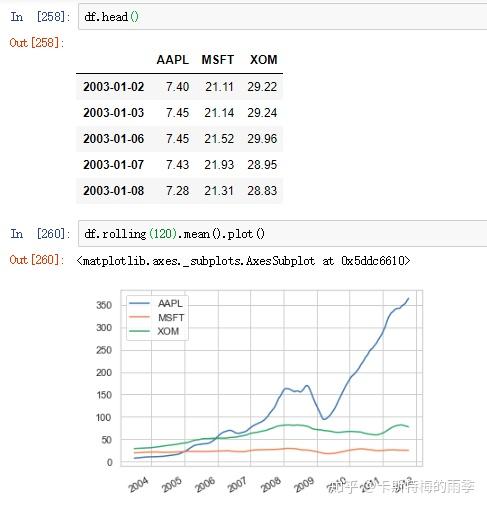
如果对DataFrame调用rolling().mean()之类的函数时,会将转换应用到所有的列上:

X. 频率和时间、日期的偏移
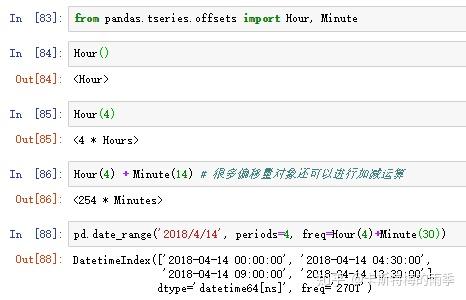
i)显式创建pd.tseries.offsets对象
下面这段pandas基本频率的描述来自Wes McKinney 《利用Python进行数据分析》
pandas中的频率是由一个基础频率(base frequency)和一个乘数组成的。基础频率都用一个字符串别名表示,比如'M'表示每月,'H'表示每小时。对于每个基础频率,都有一个被称为日期偏移量(date offset)的对象与之对应。

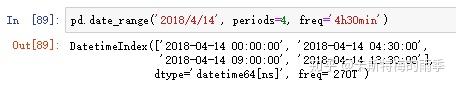
ii)使用字符串别名
其实我们可以用'4h30min'这样的字符串别名替代Hour(4)+Minute(30)

换个偏移量

iii)时间、日期的偏移
>>>df = pd.read_csv(path, engine='python', encoding='utf_8_sig',index_col='time',parse_dates=True)
>>>s = '2018-12-08 00:08'
>>>d = parse(s) + Minute(2)
Timestamp('2018-12-08 00:10:00')
>>>df.loc[d]
open          3.341530e+03
high          3.343600e+03
low           3.335010e+03
close         3.339980e+03
volume        2.214765e+05
OBV           1.255913e+06