

时间序列预测(一)基于Prophet的销售额预测

时间序列预测(一)基于Prophet的销售额预测
小O:小H,有没有什么方法能快速的预测下未来的销售额啊 小H:Facebook曾经开源了一款时间序列预测算法 fbprophet ,简单又快速~
传统的时间序列算法很多,例如AR、MA、ARIMA等,对于非专业人员来说显得很难上手。而Prophet相对来说就友好多了,而且预测效果又很不错,所以用它来预测时间序列数据再适合不过了。本文主要参考 基于facebook的时间序列预测框架prophet的实战应用[1] 。
Prophet的安装需要先安装pystan
conda install pystan # 终端上安装,需要执行procced选择y
pip install fbprophet
数据探索
import matplotlib.pyplot as plt
import pandas as pd
import numpy as np
import seaborn as sns
from fbprophet import Prophet
from sklearn.metrics import mean_squared_error
from math import sqrt
import datetime
from xgboost import XGBRegressor
from sklearn.metrics import explained_variance_score, mean_absolute_error, \
mean_squared_error, r2_score  # 批量导入指标算法
from tensorflow.keras.models import Sequential
from tensorflow.keras.layers import LSTM
from tensorflow.keras.layers import Dense, Dropout
from sklearn.preprocessing import MinMaxScaler
from keras.wrappers.scikit_learn import KerasRegressor
from sklearn.model_selection import GridSearchCV# 读取数据
raw_data = pd.read_csv('train.csv')
raw_data.head()
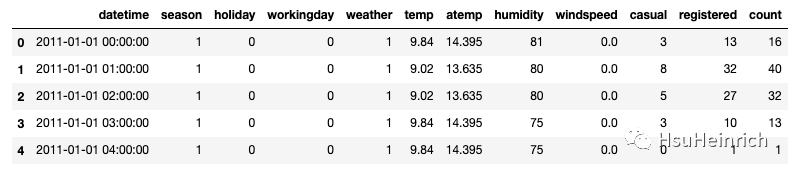
image-20230206153328512
# 转化为日期
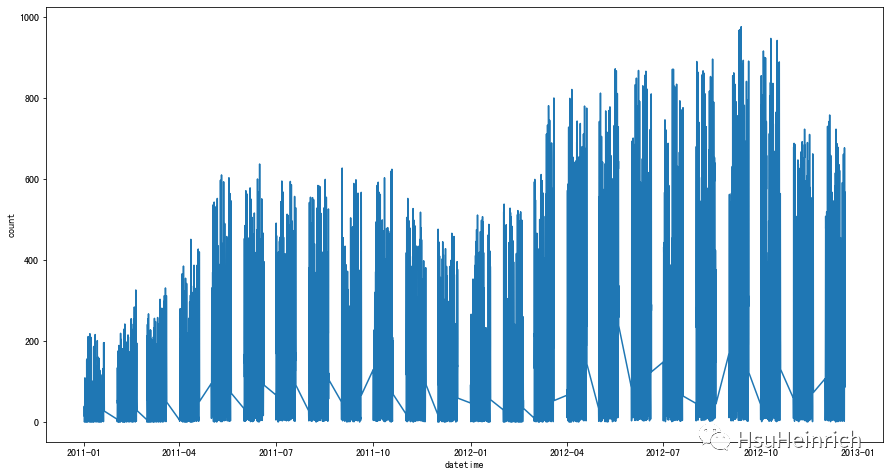
raw_data['datetime'] = raw_data['datetime'].apply(pd.to_datetime)
# 查看历史销售趋势
plt.figure(figsize = (15,8))
sns.lineplot(x = 'datetime', y = 'count', data = raw_data, err_style=None)
plt.show()
output_10_0
特征工程
# 构造prophet需要的ds/y数据
df_model = raw_data[['datetime', 'count']].rename(columns = {'datetime': 'ds','count': 'y'})
模型拟合
# 模型拟合
model_fb = Prophet(interval_width = 0.95).fit(df_model)
# 构造预测日期
future_dates = model_fb.make_future_dataframe(periods = 100, freq='H')
# 预测结果
forecast = model_fb.predict(future_dates)
INFO:fbprophet:Disabling yearly seasonality. Run prophet with yearly_seasonality=True to override this.
# 预测最后几周的日期
forecast[['ds', 'yhat', 'yhat_lower', 'yhat_upper']].tail()
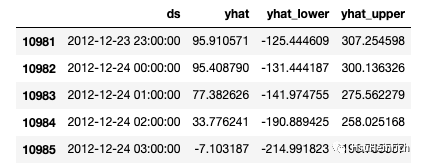
image-20230206153349362
结果展示
# 观察预测效果
model_fb.plot(forecast);
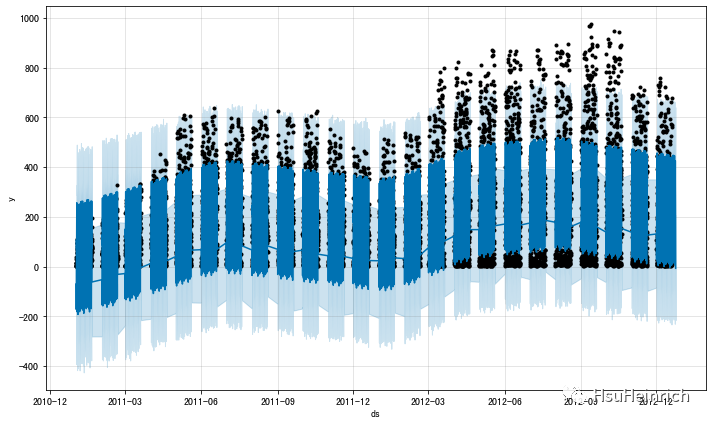
output_16_0
# 观察趋势因素
model_fb.plot_components(forecast);

output_17_0
# 模型评估 MSE
metric_df = forecast.set_index('ds')[['yhat']].join(df_model.set_index('ds').y).reset_index()
metric_df.dropna(inplace=True)
error = mean_squared_error(metric_df.y, metric_df.yhat)
print('The MSE is {}'. format(error))
The MSE is 12492.842870220222
添加假期因素
# 定义假期因素
def is_school_holiday_season(ds):
    date = pd.to_datetime(ds)
    starts = datetime.date(date.year, 7, 1)
    ends = datetime.date(date.year, 9, 9)
    return starts < date.to_pydatetime().date() < ends
df_model['school_holiday_season'] = df_model['ds'].apply(is_school_holiday_season)
df_model['not_school_holiday_season'] = ~df_model['ds'].apply(is_school_holiday_season)
model_fb = Prophet(interval_width=0.95)
# 添加假期因素
model_fb.add_seasonality(name='school_holiday_season', period=365, fourier_order=3, condition_name='school_holiday_season')
model_fb.add_seasonality(name='not_school_holiday_season', period=365, fourier_order=3, condition_name='not_school_holiday_season')
model_fb.fit(df_model)
INFO:fbprophet:Disabling yearly seasonality. Run prophet with yearly_seasonality=True to override this.
<fbprophet.forecaster.Prophet at 0x7ff4e48833d0>
# 构造日期
future_dates = model_fb.make_future_dataframe(periods=100, freq='H')
future_dates['school_holiday_season'] = future_dates['ds'].apply(is_school_holiday_season)
future_dates['not_school_holiday_season'] = ~future_dates['ds'].apply(is_school_holiday_season)
# 预测
forecast = model_fb.predict(future_dates)
plt.figure(figsize=(10, 5))
model_fb.plot(forecast);
<Figure size 720x360 with 0 Axes>

output_24_1
# 观察趋势因素
model_fb.plot_components(forecast);
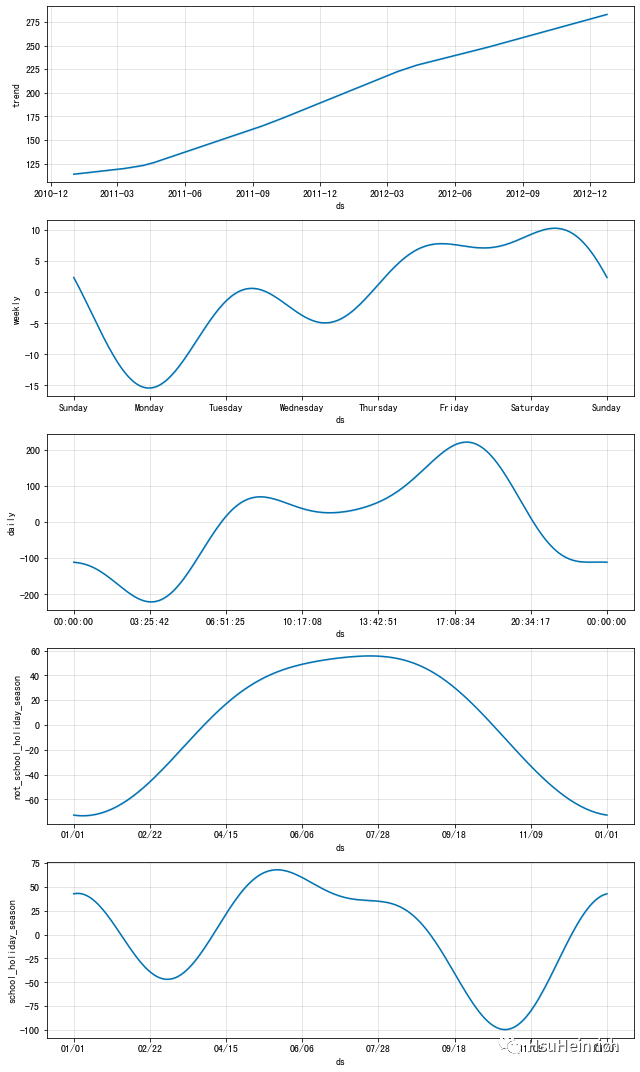
output_25_0
# 模型评估 MSE