R语言ggplot如何添加图例?
6 个回答
以第一个图为例进行说明
px <- ggplot()+
  geom_point(data = plotdatax, aes(x= number , y= datax, color = "red", shape = "A", linetype = "A"), size=2 ) +
  geom_line(data = plotdatax, aes(x=number,y = dataxo, color = "black", shape = "B", linetype = "B"), size = 1 ) +
  scale_color_manual(name = "group",
                     values = c('red' = 'red', "black" = 'black'),
                     breaks = c("red", "black"),
                     labels = c('数据', '原始数据')) +
  scale_shape_manual(name = "group",
                     values = c("A" = 16, "B" = NA),
                     labels = c('数据', '原始数据')) +
  scale_linetype_manual(name = "group",
                          values = c("A" = 0, "B" = 1),
                          labels = c('数据', '原始数据'))
px + theme(legend.title=element_blank(),
           legend.position = c(0.9, 0.9))
得到的图为

虽然与题主要求相符,但其实上述代码会报warning,如下

原因是geom_point中的aes没有linetype参数;
而geom_line中的aes没有shape参数,但如果前者不对linetype进行赋值,后者不对shape进行赋值,则得到的图形会有两个图例块。

更简洁更准确的做法应该是先对这些点进行标签,然后设置每个标签的color, shape以及linetype,代码如下:
plotdatax$group = ifelse(datax == dataxo, "c2", "c1")
px <- ggplot(plotdatax, aes(color = group, shape = group, linetype = group))+
  geom_point(aes(x= number , y= datax), size=2 ) +
  geom_line(aes(x=number,y = dataxo), size = 1 ) +
  scale_color_manual(name = "group",
                     values = c("c1" = 'red', "c2" = 'black'),
                     labels = c('数据', '原始数据')) +
  scale_shape_manual(name = "group",
                     values = c("c1" = 16, "c2" = NA),
                     labels = c('数据', '原始数据')) +
  scale_linetype_manual(name = "group",
                        values = c("c1" = 0, "c2" = 1),
                        labels = c('数据', '原始数据'))
px + theme(legend.title=element_blank(),
           legend.position = c(0.9, 0.9))
得到如下图

不过这样黑线少掉了红色点,也就是认为那些不在直线上的点才是第二类的点。如果坚持题主的意思,则完全可以重新构造数据集,代码如下
length <-length(datax)
x.matrix1 <- cbind(1:length, datax)
x.matrix2 <- cbind(1:length, dataxo)
x.matrix <- rbind(x.matrix1, x.matrix2)
colnames(x.matrix) <- c("number", "datax")
plotdatax <- as.data.frame(x.matrix)
plotdatax$group <- rep(c("c1", "c2"), each = length)
px <- ggplot(plotdatax, aes(x = number, y = datax, color = group, shape = group, linetype = group))+
  geom_point(size=2) +
  geom_line(size = 1) +
  scale_color_manual(name = "group",
                     values = c("c1" = 'red', "c2" = 'black'),
                     labels = c('数据', '原始数据')) +
  scale_shape_manual(name = "group",
                     values = c("c1" = 16, "c2" = NA),
                     labels = c('数据', '原始数据')) +
  scale_linetype_manual(name = "group",
                        values = c("c1" = 0, "c2" = 1),
                        labels = c('数据', '原始数据'))
px + theme(legend.title=element_blank(),
           legend.position = c(0.9, 0.9))

PS: 在看到该问题时,我对ggplot中legends的使用也不是很熟,所以算是从零开始,将回答这个问题的过程(遇到的坑)记录在下面的博文中了
安装、加载包
#设置工作环境
rm(list=ls())
setwd("D:\\桌面\\ggplot2添加图例及图例相关设置")
# install.packages("ggpubr")
# install.packages('ggplot2')
# install.packages('reshape2')
library(ggpubr)
library(ggplot2)
library(reshape2)
加载数据并绘图
#读取数据
df <- read.table(file="Genus.txt",sep="\t",header=T,check.names=FALSE,row.names = 1)
#转换数据
df$Tax=rownames(df)
df1=melt(df)
colnames(df1)=c("Tax","Samples","value")
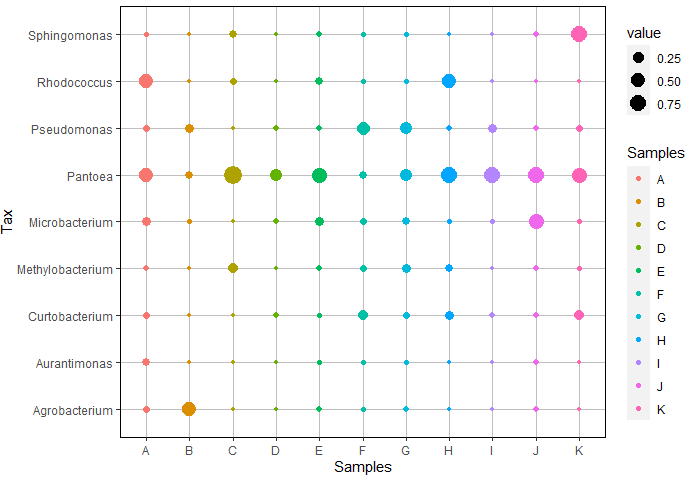
p <- ggplot(df1, aes(x = Samples, y = Tax, size = value, color=Samples)) +
  geom_point(aes(size=value))+
  theme(panel.background = element_blank(),
        panel.grid.major = element_line(color = "gray"),#网格线条颜色
        panel.border = element_rect(color="black",fill=NA))#边框色
图例设置
1、图例关闭——三种方法
p+theme(legend.position = 'none')#关闭全部图例
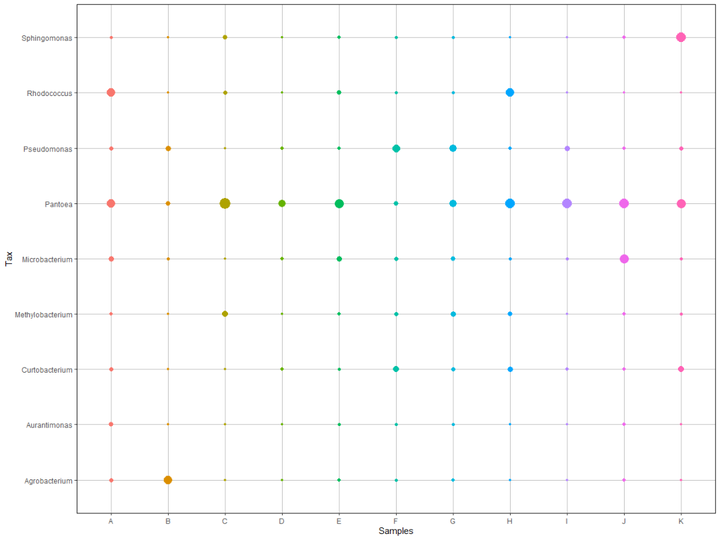
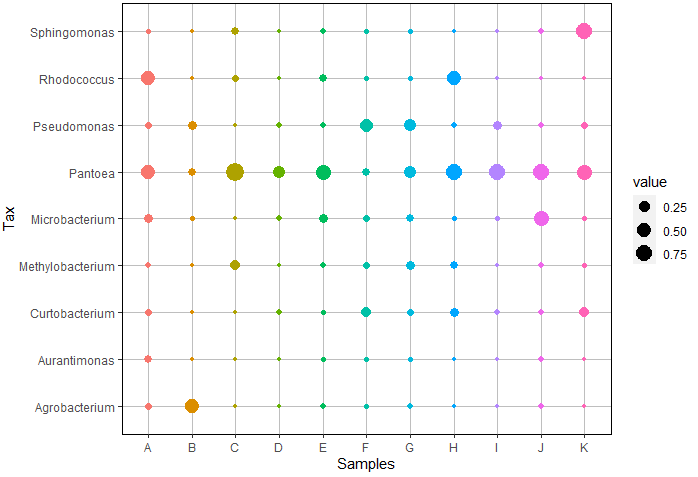
p+guides(color='none')#关闭部分图例,如图例中散点颜色的部分图例
p+scale_color_discrete(guide='none')#关闭部分图例,如图例中散点颜色的部分图例
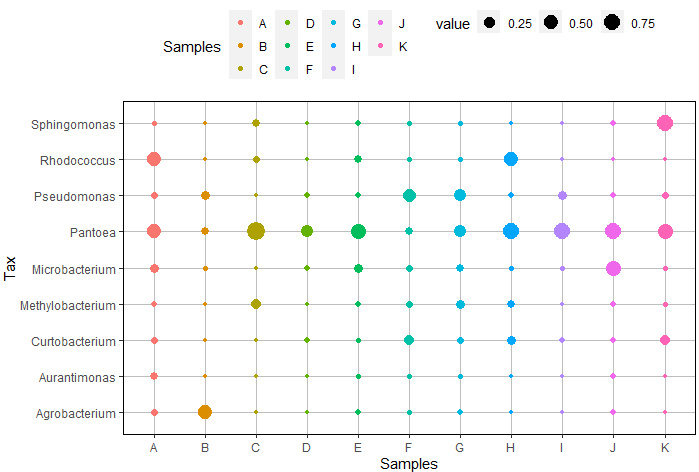
2、图例位置,可以通过theme中的legend.position函数控制图例位置
p+theme(legend.position = 'top')#控制图例放置在图中上下左右('top','bottom','right','left')
p+theme(legend.position = c(0.95,0.6))#通过设置位置坐标控制图例位置,范围为0~1
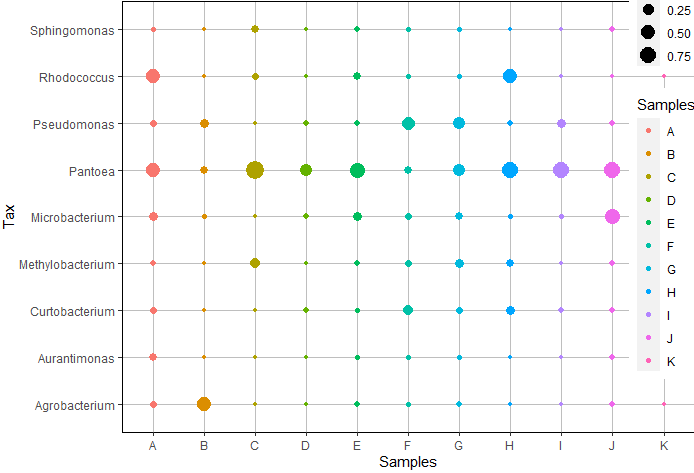
3、图例方向——通过legend.direction函数或者guides中的guide_legend控制:
p+theme(legend.direction = 'horizontal')#有垂直与竖直两种方向,‘horizontal’,‘vertical’
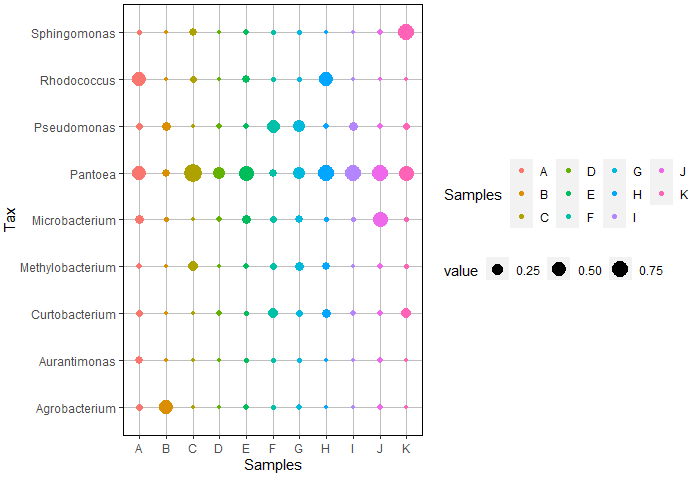
#精准设置
p+guides(color=guide_legend(ncol = 3,#根据ncol或者nrow设置图例显示行数或列数(设置一个即可)
                            byrow = T,#默认F,表示按照列填充
                            reverse = T))#默认F,表示升序填充,反之则降序
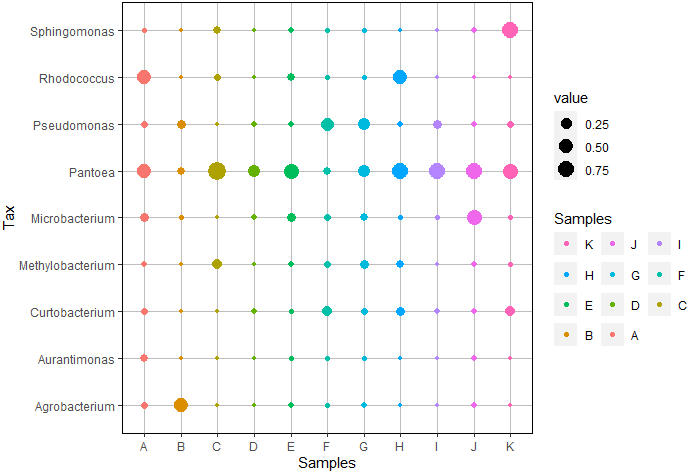
4、图例标题去除——三种方式
p+theme(legend.title = element_blank())#删除所有图例
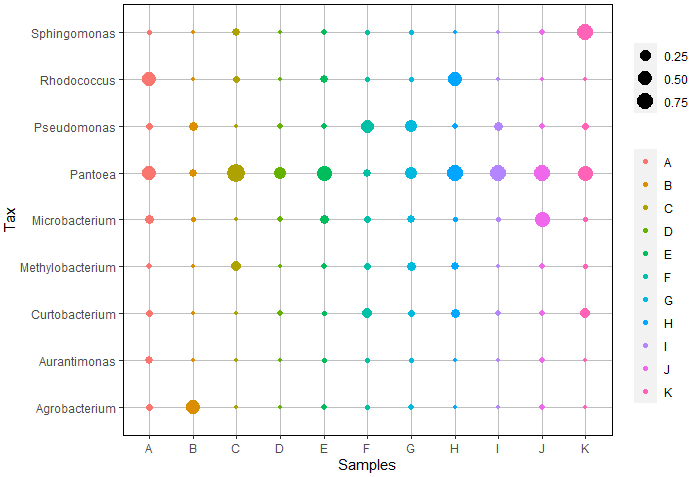
p+labs(color=NULL)#删除所有图例
p+scale_color_discrete(name=NULL)#只删除部分图例
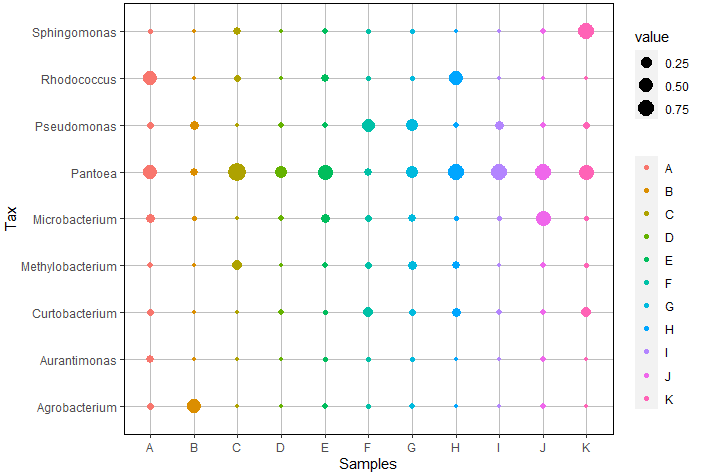
5、图例符号周围区域大小及符号本身大小设置
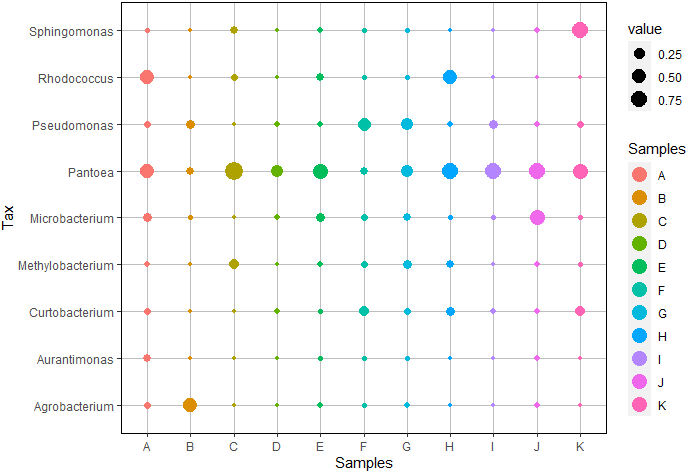
p+theme(legend.key.size = unit(20,"point"))#增加符号周围的区域
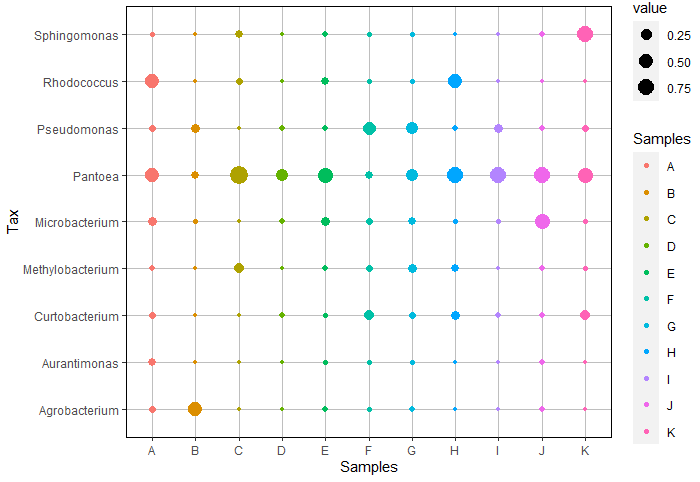
p+guides(color = guide_legend(override.aes = list(size = 5)))#改变符号大小
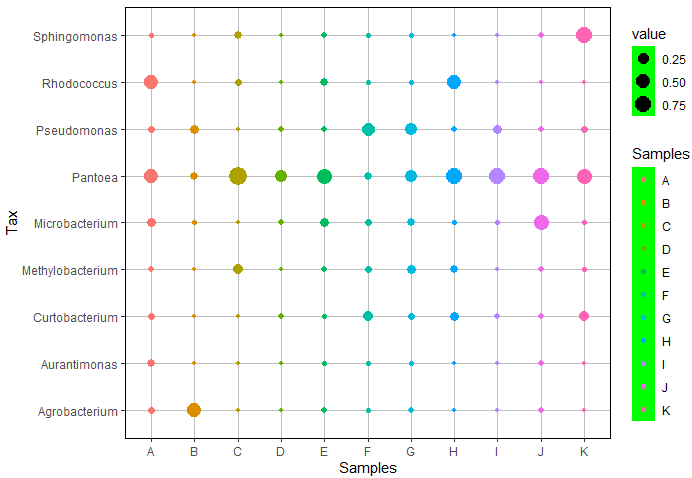
6、图例框的填充颜色
p+theme(legend.key = element_rect(fill = 'green'))
7、自定义图例标签顺序——通过将数据中的相应列数据转换为factor型数据进而调整显示顺序
df1$Samples=factor(df1$Samples,levels = c('B','A','D','C','F','G','H','I','J','E','K'))#定义顺序


