


Kaggle 实战之数字识别 -- 新手入门SVM分类算法(Python)

介绍
正如《机器学习实战》所说:“机器学习的主要任务就是分类。”这项数字识别竞赛就是在考验对机器学习的分类功能的掌握水平。这篇文章面向新手而写,自然有其局限性,但却很适合那些对这项竞赛无从下手的新手们。同为机器学习新手的我,也在这些实践中获益匪浅。
首先我们导入相关的库:
import pandas as pd
import matplotlib.pyplot as plt, matplotlib.image as mpimg
from sklearn.model_selection import train_test_split
from sklearn import svm
%matplotlib inline
载入数据
- 首先使用pandas包中的read_csv()函数来读取train.csv文件,将数据存入数据框中;
- 然后为之后的监督学习分离出图片和标签;
- 使用train_test_split()来将数据分为两半,一个是训练数据,另一个是测试数据。这能让我们通过在测试数据里的结果了解到我们的模型的分类表现如何。
考虑到时间问题,我们将只用5000个图片数据。你也可以增加或减少使用的图片数量来观察数据量是如何影响训练模型的。
labeled_images = pd.read_csv('../input/train.csv')
images = labeled_images.iloc[0:5000,1:]
labels = labeled_images.iloc[0:5000,:1]
train_images, test_images,train_labels, test_labels = train_test_split(images, labels, train_size=0.8, random_state=0)
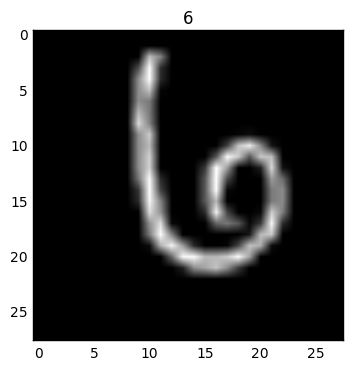
预览图片
- 由于图片是一维数据,我们可以将它导入到一个 numpy 数组中,并将其重塑变为二维数组(28x28像素);
- 然后使用matplotlib来绘制图形并注上标签。
在此可以改变i值来查看其它的图片和标签。
i=1
img=train_images.iloc[i].as_matrix()
img=img.reshape((28,28))
plt.imshow(img,cmap='gray')
plt.title(train_labels.iloc[i,0])
输出结果:
Out[3]: <matplotlib.text.Text at 0x7f76efe57978>
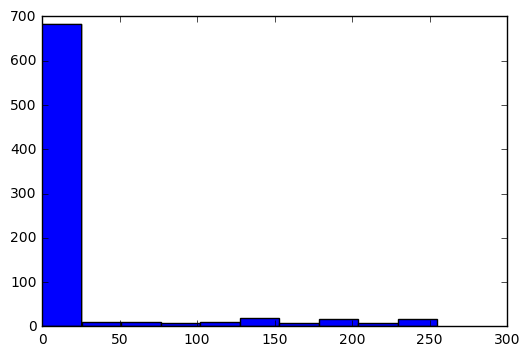
检查像素值
注意:这些图片并非是黑白的。他们是有不同灰度值的(0-255)。
用直方图显示该图片的像素值:
plt.hist(train_images.iloc[i])输出结果:
Out[4]: (array([ 682., 9., 10., 7., 10., 18., 7., 17., 7., 17.]),
array([ 0. , 25.5, 51. , 76.5, 102. , 127.5, 153. , 178.5,
204. , 229.5, 255. ]),
<a list of 10 Patch objects>)

训练模型
- 首先使用sklearn.svm库来创建向量分类器;
- 然后将训练数据导入分类器的fit方法,它将训练我们的模型;
- 最后,测试图形和标签将传入score方法来测试其有效性。fit方法将返回一个0到1之间的浮点值以表示模型在分类测试数据时的准确性。
你也可以试试svm.SVC()中的参数来观察结果是如何变化的。
clf = svm.SVC()
clf.fit(train_images, train_labels.values.ravel())
clf.score(test_images,test_labels)
输出结果:
Out[5]: 0.10000000000000001
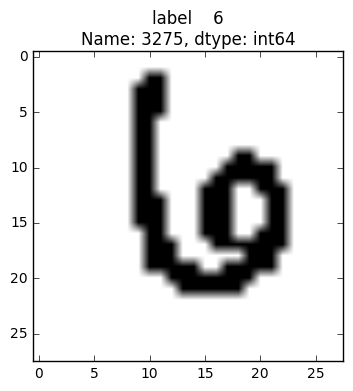
如何改善模型呢?
上述测试后,得到的准确性约为0.10,是个十分不理想的结果。10%的准确性和你随机猜一个数字的几率一样。我们可以有不少方法来提高准确性,包括不使用向量分类器,但在此我讲介绍个较为简单的方法。先将图片简化为黑白。
- 也就是说,图片中的任何像素将简化为1或0;
- 然后再次绘图,看看效果如何。
test_images[test_images>0]=1
train_images[train_images>0]=1
img=train_images.iloc[i].as_matrix().reshape((28,28))
plt.imshow(img,cmap='binary')
plt.title(train_labels.iloc[i])
输出结果:
Out[6]: /opt/conda/lib/python3.5/site-packages/ipykernel/__main__.py:1: SettingWithCopyWarning:
A value is trying to be set on a copy of a slice from a DataFrame.
Try using .loc[row_indexer,col_indexer] = value instead
See the caveats in the documentation: http://pandas.pydata.org/pandas-docs/stable/indexing.html#indexing-view-versus-copy
if __name__ == '__main__':
/opt/conda/lib/python3.5/site-packages/pandas/core/frame.py:2392: SettingWithCopyWarning:
A value is trying to be set on a copy of a slice from a DataFrame
See the caveats in the documentation: http://pandas.pydata.org/pandas-docs/stable/indexing.html#indexing-view-versus-copy
self.where(-key, value, inplace=True)
/opt/conda/lib/python3.5/site-packages/ipykernel/__main__.py:2: SettingWithCopyWarning:
A value is trying to be set on a copy of a slice from a DataFrame.
Try using .loc[row_indexer,col_indexer] = value instead
See the caveats in the documentation: http://pandas.pydata.org/pandas-docs/stable/indexing.html#indexing-view-versus-copy
from ipykernel import kernelapp as app
<matplotlib.text.Text at 0x7f76efd54da0>
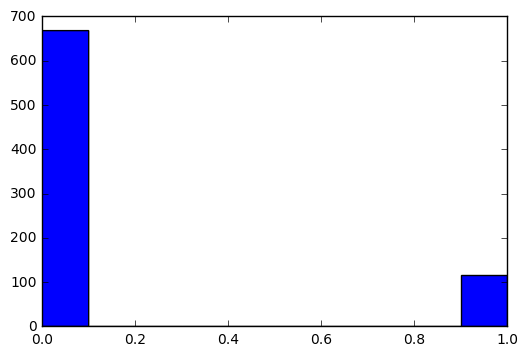
生成直方图:
plt.hist(train_images.iloc[i])输出结果:
Out[7]: (array([ 668., 0., 0., 0., 0., 0., 0., 0., 0., 116.]),
array([ 0. , 0.1, 0.2, 0.3, 0.4, 0.5, 0.6, 0.7, 0.8, 0.9, 1. ]),
<a list of 10 Patch objects>)

重新训练模型
这个过程和之前的过程相同,但现在训练数据和测试数据都是黑白图而不是不同灰度值的图。score结果依旧不是很好,但有了很大提升。
clf = svm.SVC()
clf.fit(train_images, train_labels.values.ravel())
clf.score(test_images,test_labels)
输出结果:
Out[8]: 0.88700000000000001
给测试数据加标签
现在我们可以载入并预测test.csv中的未标签数据。这次我们依旧只使用前5000张图,然后输出数据到results.csv中。
test_data=pd.read_csv('../input/test.csv')